

Pgiam/iStock via Getty Images
Pgiam/iStock via Getty Images
Market prices are being forecast every day by self-protective, disruptive actions taken by MMs negotiating big-volume block trades for institutional investors managing their $Billion equity investment portfolios.
Records of market outcomes following such daily forecasts make their trends visually follow-able and their rewards and risk exposures explicit in graphic form. The pictures seen below are the negotiated forecast outcome expectations, not some hoped-for tools to guess at what may happen later. While there are no guarantees of the future, examples in hand are far better than hypotheses of assertion without evidence.
Moreover, the outcomes follow identical strategy disciplines for all stocks, making expectations of forecasts directly comparable. In that way personal investment needs and preferences can be carefully followed.
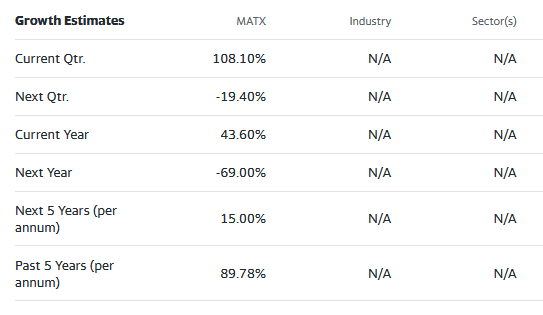
This article’s attention is primarily on Matson, Inc. (NYSE:MATX)
“Matson, Inc., together with its subsidiaries, provides ocean transportation and logistics services. The company’s Ocean Transportation segment offers ocean freight transportation services to the domestic non-contiguous economies of Hawaii, Alaska, and Guam, as well as to other island economies in Micronesia. It primarily transports dry containers of mixed commodities, refrigerated commodities, packaged foods and beverages, building materials, automobiles, and household goods; livestock; seafood; general sustenance cargo; and garments, footwear, e-commerce, and other retail merchandise. This segment also operates an expedited service from China to Long Beach, California, and various islands in the South Pacific, as well as Okinawa, Japan. The company was formerly known as Alexander & Baldwin Holdings, Inc. and changed its name to Matson, Inc. in June 2012. Matson, Inc. was founded in 1882 and is headquartered in Honolulu, Hawaii.”
Yahoo Finance
Yahoo Finance
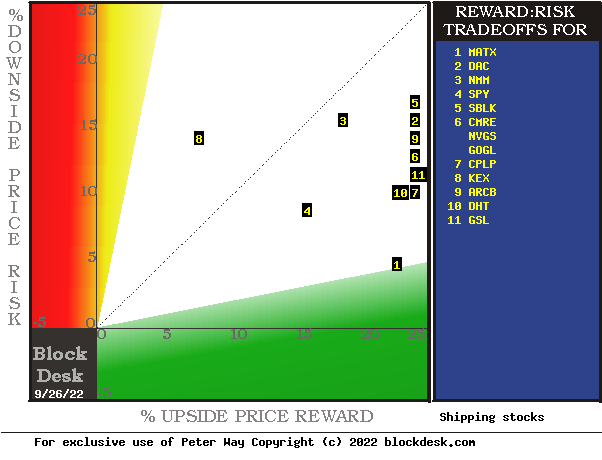
Figure 1
blockdesk.com
blockdesk.com
(used with permission)
Expected rewards for these securities are of the largest gains from current closing market price seen worth protecting for short positions. Their measure is on the horizontal green scale.
The risk dimension is of actual price drawdowns at their most extreme point while being held in previous pursuit of upside rewards similar to the ones currently being seen. They are measured on the red vertical scale.
Both scales are of percent change from zero to 25%. Any stock or ETF whose present risk exposure exceeds its reward prospect will be above the dotted diagonal line. Capital-gain attractive to-buy issues are in the directions down and to the right.
Our principal interest is in MATX at location [1]. A “market index” norm of reward~risk tradeoffs is offered by SPY at [4]. The most appealing (to own) by this Figure 1 view is MATX.
The Figure 1 map provides a good visual comparison of the two most important aspects of every equity investment in the short term. There are other aspects of comparison which this map sometimes does not communicate well, particularly when general market perspectives like those of SPY are involved. And where questions of “how likely’ are present other comparative tables, like Figure 2, may be useful.
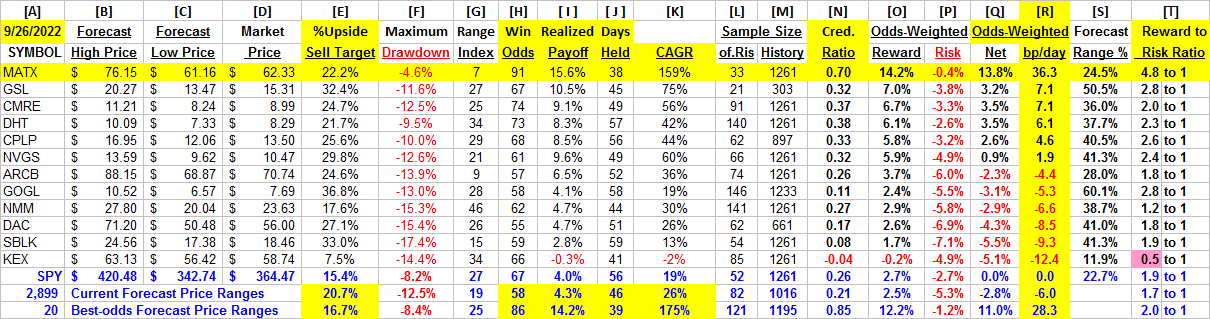
Figure 2
blockdesk.com
blockdesk.com
used with permission
Yellow highlighting of the table’s cells emphasize factors important to securities valuations and the security MATX, most promising of near capital gain as ranked in column [R]. Pink cell fills show where performance is likely to disappoint, as in [T] where [F] Risk exposure exceeds [E] Reward opportunity.
Readers familiar with our analysis methods after quick examination of Figure 2 may wish to skip to the next section viewing Price range forecast trends for MATX.
The price range forecasts implied by the day’s transactions activity are in columns [B] and [C], typically surrounding the day’s closing price [D]. They produce a measure of risk and reward we label the Range Index [G], the percentage of the B to C forecast range which lays between D and C.
Today’s Gs are used for each stock’s past 5-years of daily forecast history [M] to count and average prior [L] experiences. Fewer than 20 of Ls or a shorter than 3 years history of Ms are regarded as statistically inadequate.
[H] tells what percentage of the L positions were completed profitably, either at range-top prices or by market close above day after forecast close price entry costs. The Net realization of all Ls is shown in [ I ].
[ I ] fractions get weighted by H and 100-H in [O,P, & Q] appropriately conditioned by [J] to provide investment ranking [R] in CAGR units of basis points per day.
The parade of [H] profitable positions at 10 out of every 11 is excellent.
Comparable data for the S&P 500 Market Index ETF (SPY) and for the 3,000 other equities population with comparable price forecasts provide perspective to the Covid stocks group outcomes. Top-ranked issues from that population support MATX’s excellent CAGR score.
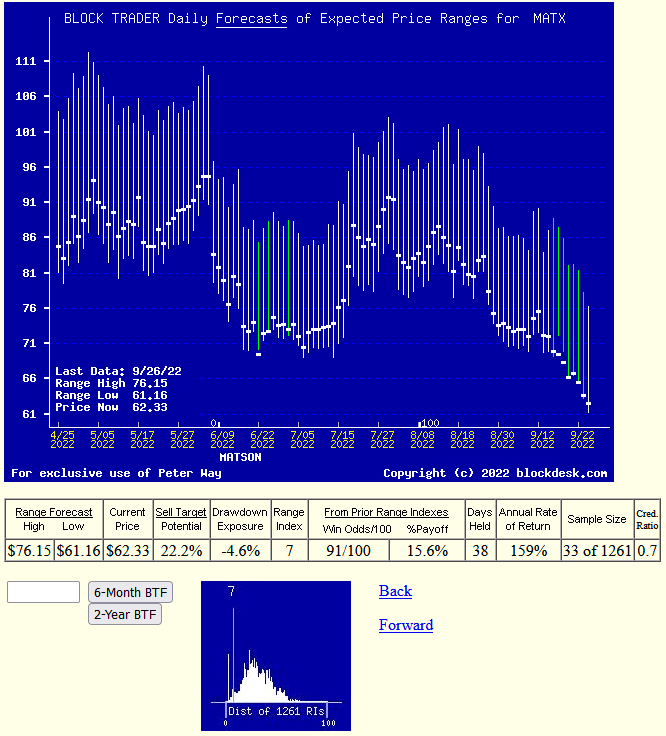
Figure 3
blockdesk.com
blockdesk.com
(used with permission)
No, this is not a “technical analysis chart” showing only historical data. It is a Behavioral Analysis picture of the Market-Making community’s actions in hedging investments of the subject. Those actions define expected price change limits shown as vertical bars with a heavy dot at the closing price on the date of the forecast.
It is an actual picture of expected future prices by experienced market professionals, not a simple hope of a recurrence of the past. Expectations are backed up by significant bets of investment capital made to protect market-makers or to earn a proprietary profit from risk-taking.
The special value of such pictures is their ability to immediately communicate the balance of expectation attitudes between optimism and pessimism. We quantify that balance by calculating what proportion of the price-range uncertainty lies to the downside, between the current market price and the lower expected limit, labeled the Range Index [RI].
A RI at zero indicates no further price decline is likely, but not guaranteed. The odds of 3 months passing without either reaching or exceeding the upper forecast limit or being at that time below the expected lower price (today’s) are quite slight.
The probability function of price changes for MATX are stated in its prior experience in Figure 2. The performance of forecasts with today’s Reward to Risk balance is realistic and significant.
The multi-path valuations explored by the analysis covered in Figure 2 is rich testimony to the near-future value prospect advantage of a current investment in Matson, Inc. over and above the other compared alternative investment candidates.
This article was written by
Disclosure: I/we have no stock, option or similar derivative position in any of the companies mentioned, but may initiate a beneficial Long position through a purchase of the stock, or the purchase of call options or similar derivatives in MATX over the next 72 hours. I wrote this article myself, and it expresses my own opinions. I am not receiving compensation for it (other than from Seeking Alpha). I have no business relationship with any company whose stock is mentioned in this article.
Additional disclosure: Additional disclosure: Peter Way and generations of the Way Family are long-term providers of perspective information, earlier helping professional investors and now individual investors, discriminate between wealth-building opportunities in individual stocks and ETFs. We do not manage money for others outside of the family but do provide pro bono consulting for a limited number of not-for-profit organizations.
We firmly believe investors need to maintain skin in their game by actively initiating commitment choices of capital and time investments in their personal portfolios. So our information presents for D-I-Y investor guidance what the arguably best-informed professional investors are thinking. Their insights, revealed through their own self-protective hedging actions, tell what they believe is most likely to happen to the prices of specific issues in coming weeks and months. Evidences of how such prior forecasts have worked out are routinely provided, both on blockdesk.com and on our Seeking Alpha Contributor website. Pls see SA articles numbered 1495621 and 1936131.