

Alex Wong
Alex Wong
The Walt Disney Company (NYSE:DIS) (“Disney”) is reportedly considered by Warren Buffett as one of his biggest mistakes. Not for losing money on it, but for missing out on massive potential returns.
In 1969, Buffett acquired a 5% stake in Disney for $4 million. Around a year later, he sold the entire stake for $6 million. It is difficult for anyone, even Warren Buffet, to consider a total return of 50% in a year a big mistake. However, when you consider that same 5% share in Disney is now valued at almost $10 billion – equivalent to an annual compound return of 16% excluding dividends – you can see how he could come to regret selling so quickly.
Disney investors have not had a smooth ride recently, with the share price down almost 50% from its recent all-time-high in March 2021. As of 21 September 2022, Disney is valued at around $195 billion. At 37 times FY21 owner earnings, it doesn’t exactly stand out as a bargain. However, since 2019 the company’s true profitability has been depressed by various factors.
The first and most obvious is the Covid-19 pandemic, which, among other things, disrupted its tv/movie production and release schedule and completely wiped out the profits from its parks and experiences business. On top of that, the pandemic came just 12 months after the company acquired Twenty-First Century Fox Inc. (“TFCF”) in a deal worth $70 billion and launched its Disney+ streaming service. As a result, any synergies from the deal have been completely obscured by the pandemic, while Disney+ has been popular but ultimately remains loss-making.
Looking at pre-acquisition net income as a proxy for earnings under ”normal” conditions, Disney’s valuation multiple reduces to a much more attractive 14 times. At this valuation, our analysis implies that investors can expect to achieve annual compound returns of 9% – 15% (including dividends) over the next decade under modest growth assumptions. There are reasons to believe that the true underlying earnings power of Disney could be higher, not least because of the TFCF acquisition.
I am a long-term holder of Disney. At the current price, I rate it as a “hold.” However, if the valuation was to decline even a little from its current level, I see reason to upgrade my rating to a “buy” and would be tempted to add to my holdings. I wonder if investors will look back on today and consider that not investing at the current price was their very own Warren Buffett moment.
Prepared by author. Data from company reports.
Prepared by author. Data from company reports.
Note: Disney recently changed its segmental reporting 2020. We have re-presented historical results using the most recent reporting segments, though the results are not directly comparable.
In recent years, Disney has been through a period of disruption and change. Some of this has been a result of external factors such as Covid-19, but there has also been the acquisition of TFCF and the launch of the Disney+ streaming platform in 2019.
The company has also changed its reporting segments a number of times in recent years. All of these can make it difficult for an investor to get a true view of the company’s profitability under “normal” operating conditions.
Since FY21, the company reports its performance across two major segments:
Disney Media and Entertainment Distribution which is the company’s famous content creation and distribution; and
Parks, Products and Experiences which offers physical experiences and products including its theme parks and cruise line.
Content is at the heart of everything Disney does. Disney’s content is created by three production / content licensing groups:
Studios which includes Walt Disney Pictures, Twentieth Century Studios, Marvel, Lucasfilm, Pixar and Searchlight Pictures.
General Entertainment which acquires and produces episodic television programs and news content across its studios: ABC Signature; 20th Television; Disney Television Animation, FX Productions and various others.
Sports which acquires professional and college sports programming rights
Prepared by author. Data from company reports.
Prepared by author. Data from company reports.
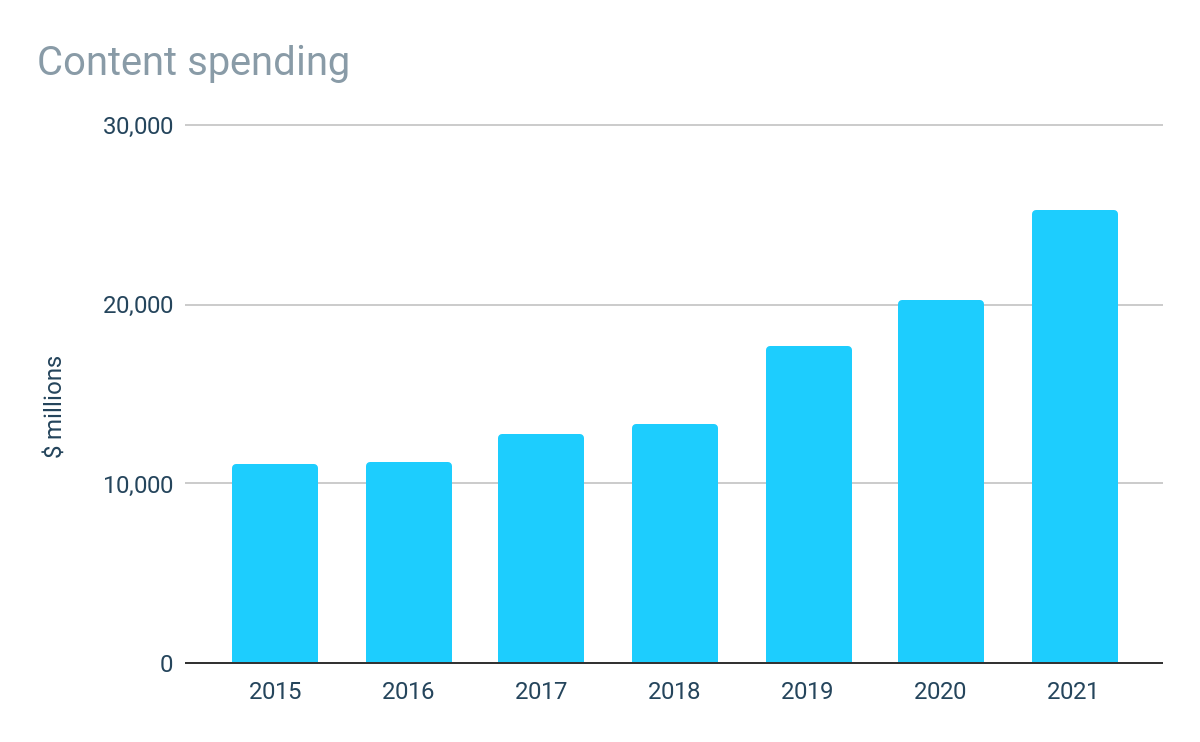
Spending on content has been increasing gradually since 2015, but has been accelerated since 2019 due to the combination with TFCF as well as the launch of Disney+. Total spending on content in 2021 was $25 billion, almost double the amount spent in 2018.
At FY21 levels, Disney is the king of overall content spending. In 2021, Netflix spent $17.5 billion on content making it the largest streaming-only content producer, while Amazon spent around $13 billion on its music and video content for its Prime subscription service.
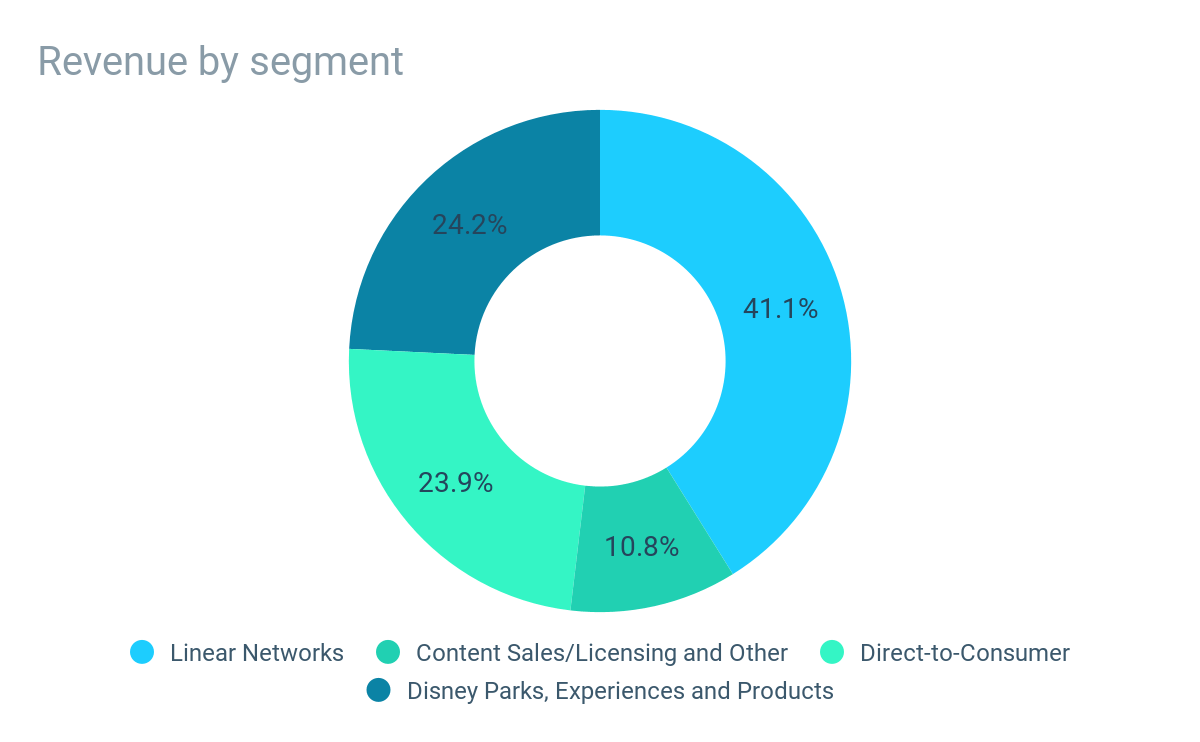
The content which is acquired or created by these groups is then monetized across three broad distribution channels: Linear Networks; Direct to Consumer; and Content Sales / Licensing.
The Linear Networks segment includes the company’s traditional domestic and international television channels which include ABC, Disney, ESPN (80% interest) as well as FX and National Geographic channels acquired as part of the TFCF acquisition. The company also has a 50% stake in A+E Television Networks which includes a variety of cable channels such as A&E, HISTORY and Lifestyle.
The vast majority of income that Disney generates from its Linear Networks is from the fees it charges to affiliates (e.g. cable network operators) for the right to broadcast its programming, with the remaining income coming from the sale of advertising time/space on its own cable networks and tv channels.
Prepared by author. Data from company reports.
Prepared by author. Data from company reports.
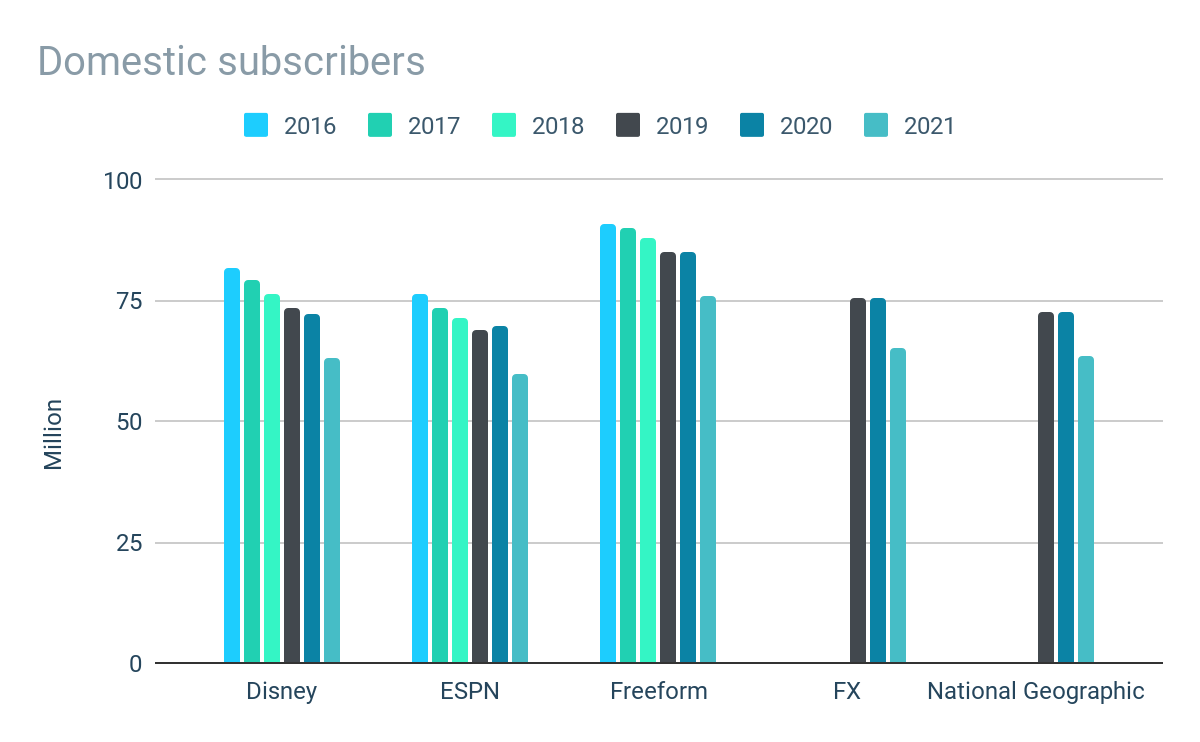
Note: Disney reports subscribers for each of its major channels. As the company does not report unique subscribers, individual subscribers may be counted under more than one channel. For this reason, we have looked at the average number of subscribers under each channel grouping.
While subscribers don’t directly pay Disney for access to its linear channels, subscriber numbers are an indicator of the demand and popularity of its channels which ultimately drives the affiliate and advertising fees that Disney can generate.
Overall, there has been a general downtrend in average subscribers across its main channels in recent years. Disney channel subscriptions had been in decline even prior to the launch of Disney+ in 2019. All other channels are also generally experiencing subscriber decline, including the FX and National Geographic acquired in the TFCF deal.
Only ESPN has bucked this trend. Prior to 2019, ESPN had been in decline but has seen its popularity return in recent years. Average subscriber numbers returned to growth in both 2020 and 2021. (The decline shown in 2021 on the chart is due to a change in how the company reports its subscriber numbers as it now shows an additional channel in its reporting which has the effect of reduced the overall average subscribers, but total subscribers have actually increased). It is not surprising that ESPN has fared better than other linear channels, with the nature of live sports means that the linear live-broadcasting format remains the most appropriate.
Prepared by author. Data from company reports.
Prepared by author. Data from company reports.
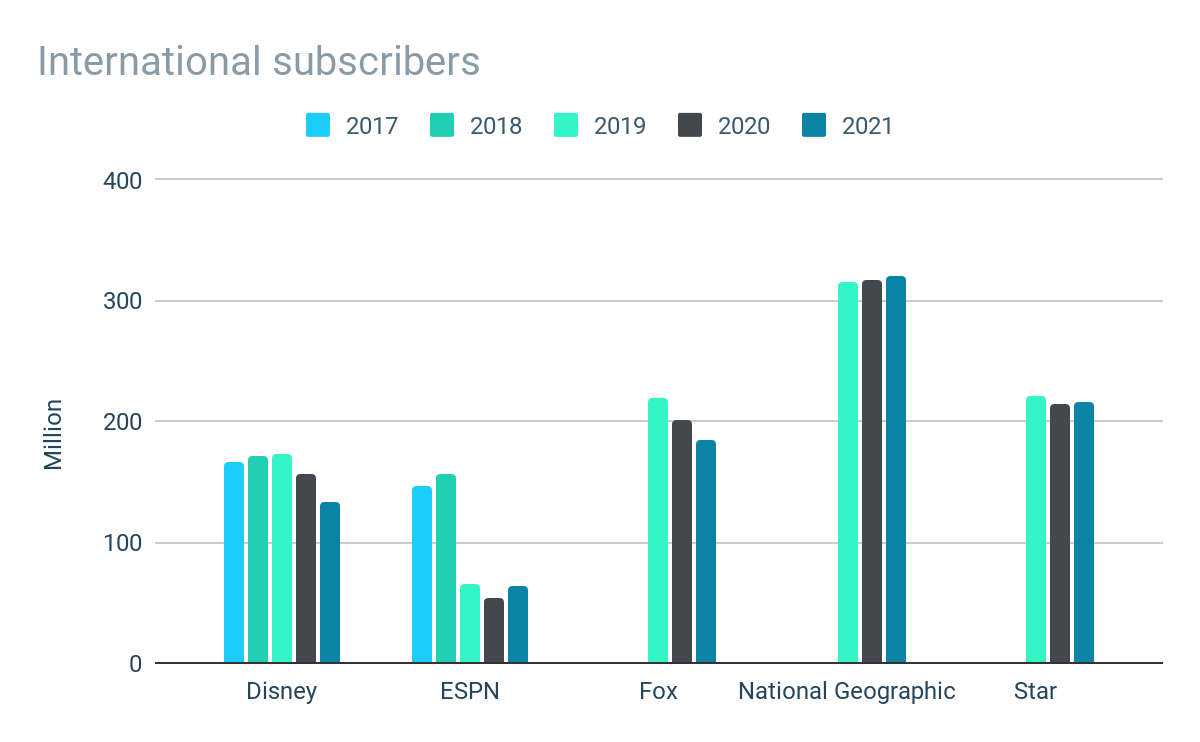
Note: Disney reports unique subscribers for each major channel grouping for international channels.
On an international basis, the overall trend of subscriber decline continues, though there are some notable differences. International subscriptions to Disney channels had actually been growing prior to the release of Disney+, but have moved into decline following the platform’s release. The popularity of ESPN has been affected to an even greater extent, with subscriptions more than halving during 2019. The channels acquired through the TFCF acquisition haven’t fared much better, with only National Geographic seeing any positive progress on subscriber numbers since it was purchased.
Prepared by author. Data from company reports.
Prepared by author. Data from company reports.
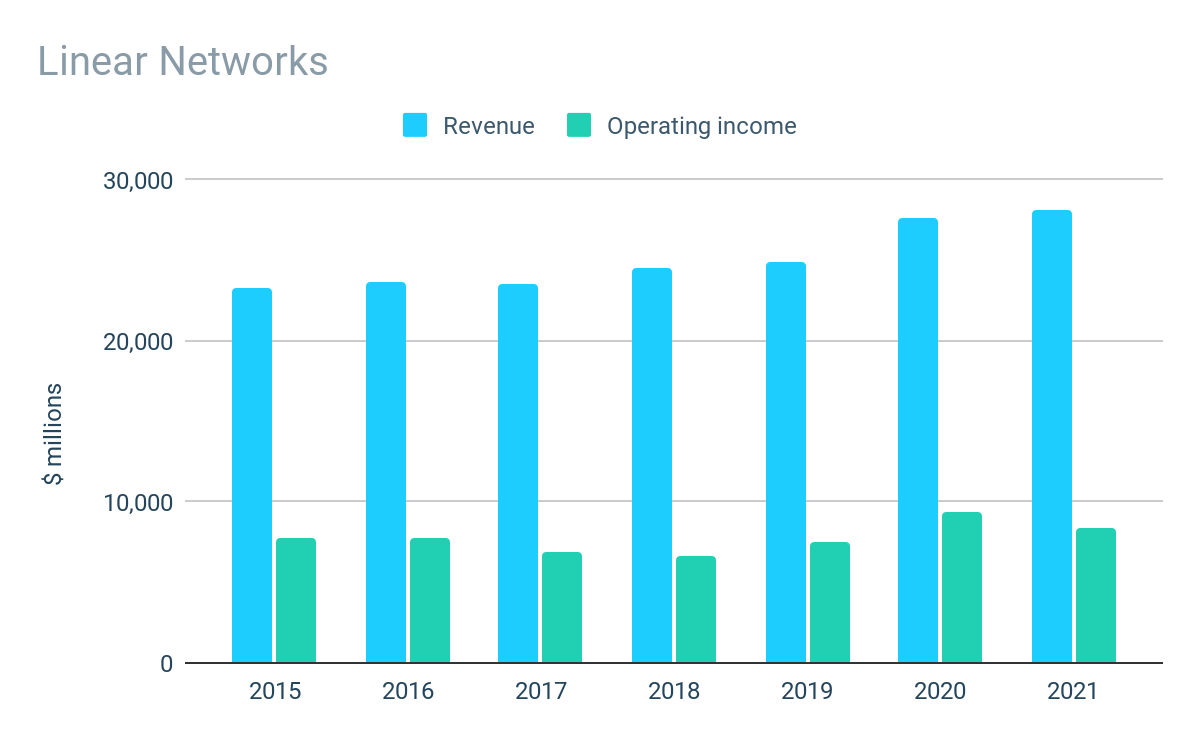
Given the overall downward trend on subscriber numbers and transition by consumers to streaming services, it is surprising that revenues from Linear Networks have not only been robust but have been growing, albeit much of the growth from 2019 onward likely being a result of the TFCF acquisition. Operating profit margins have also been consistent at around 30%, with the segment contributing over $8 billion of operating profit in FY21.
These results suggest that linear television is not dead, or at least not as dead as one would initially assume. However, with the exception of live sports, the overall trend will likely be downward with the only question being how low and how quickly the decline will be.
The DTC segment includes the company’s streaming services Disney+, ESPN+ and Hulu. The company currently owns a 67% interest in Hulu, but has full operational control. From January 2024, Disney has the option to require NBC Universal (“NBC U”) to sell its remaining stake, while NBC U have an option to require Disney to purchase its interest.
Prepared by author. Data from company reports.
Prepared by author. Data from company reports.
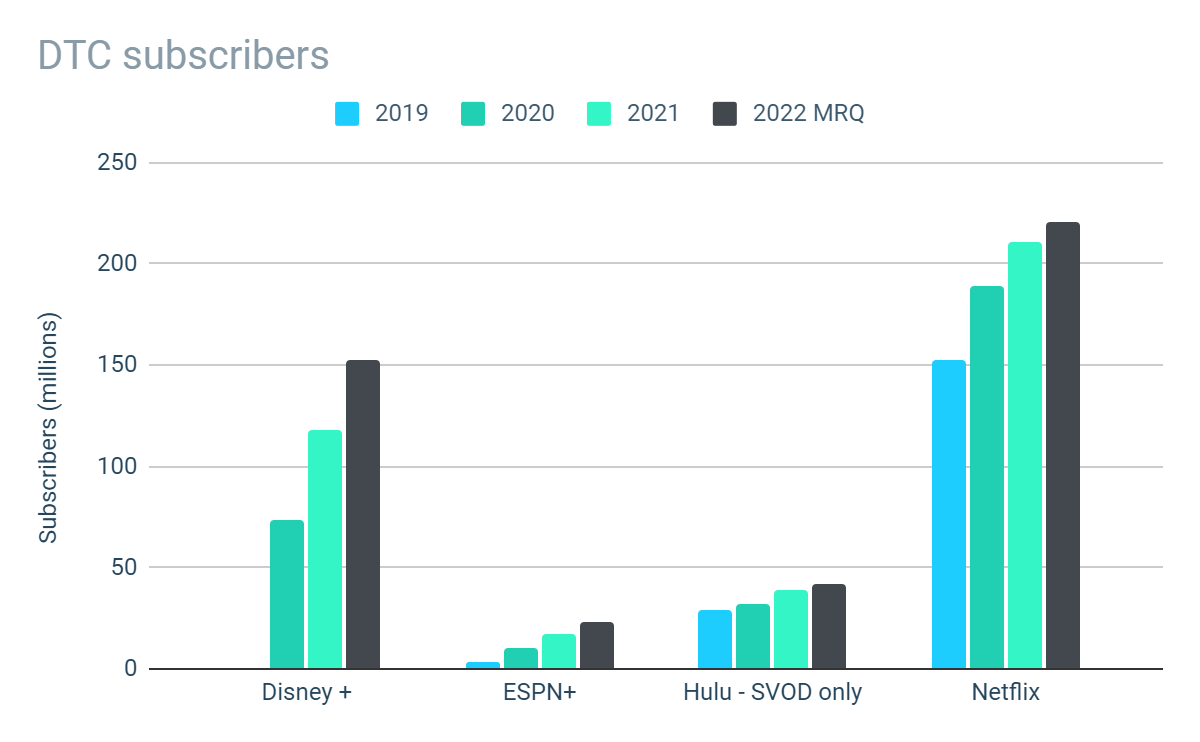
Since its launch in 2019, the Disney+ service has proved popular attracting over 150 million subscribers as of Q3 2022. Netflix remains significantly larger than Disney+ based on subscriber numbers with over 200 million subscribers, but Disney+ has attracted an impressive number of subscribers in its short existence and continues to grow at a faster rate than Netflix which is seeing subscriber growth plateau. Both ESPN+ and Hulu also continue to grow their subscriber base, but attract only a fraction of the subscribers of Disney+.
Prepared by author. Data from company reports.
Prepared by author. Data from company reports.
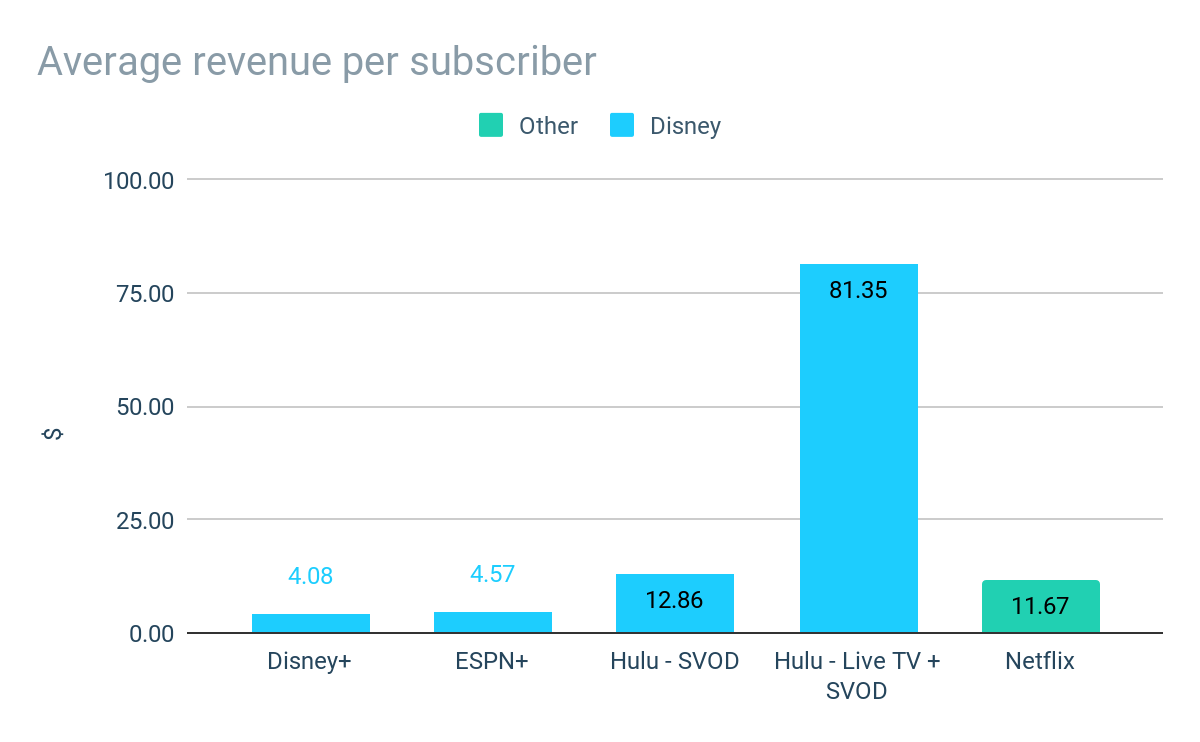
On 8 December 2022, the company will introduce its first ad-supported subscription tier on Disney+. The introduction of an ad-supported subscription should result in additional subscribers and generate supplementary revenue from advertising. Ad-supported streaming is not new to Disney, with Hulu offering an ad-supported streaming plan and advertising already accounting for around 20% of the DTC segment’s total revenue.
The ad-supported plan is being offered at around 30% less than the ad-free plan, but may actually be more profitable when advertising revenue is included. Hulu’s streaming service currently generates average revenue per user more than 3x more than Disney+, suggesting the introduction of ad-supported service could have a net positive impact on revenues and profitability of the platform.
Prepared by author. Data from company reports.
Prepared by author. Data from company reports.
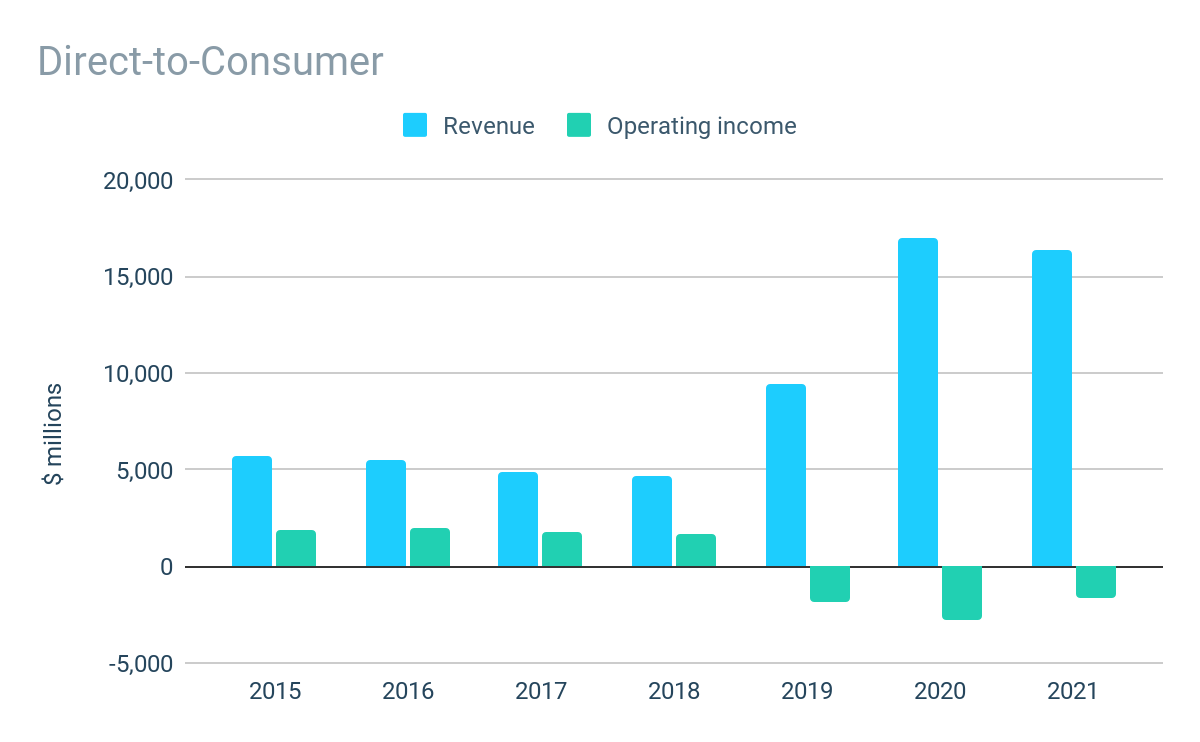
The popularity of the company’s Disney+ streaming service has driven robust revenue growth in the company’s DTC segment, which has grown by around 200% since the service was introduced (albeit the results in FY21 are not directly comparable to FY19 due to changes in the reporting segments).
Despite the growth in subscribers of Disney+ and other platforms, they have yet to reach the critical volume / pricing needed to break-even, with the segment reporting a loss of almost $2 billion in FY21. However, the company continues to make progress in FY23 with revenues up a further 25% year to date and the operating loss for the first 9 months more than halving from $2.5 billion to less than $1 billion.
At current cost and subscription prices, the company only needs to increase its subscribers and/or average revenues per subscriber by a further 7% to break even (assuming no additional content or operating costs). It is reasonable to expect the segment to achieve profitability in the coming financial year.
The rights to content which is not exclusively broadcast on Disney’s own linear channels or streaming services is sold or licensed to third party distributors including TV networks, streaming providers and movie theaters.
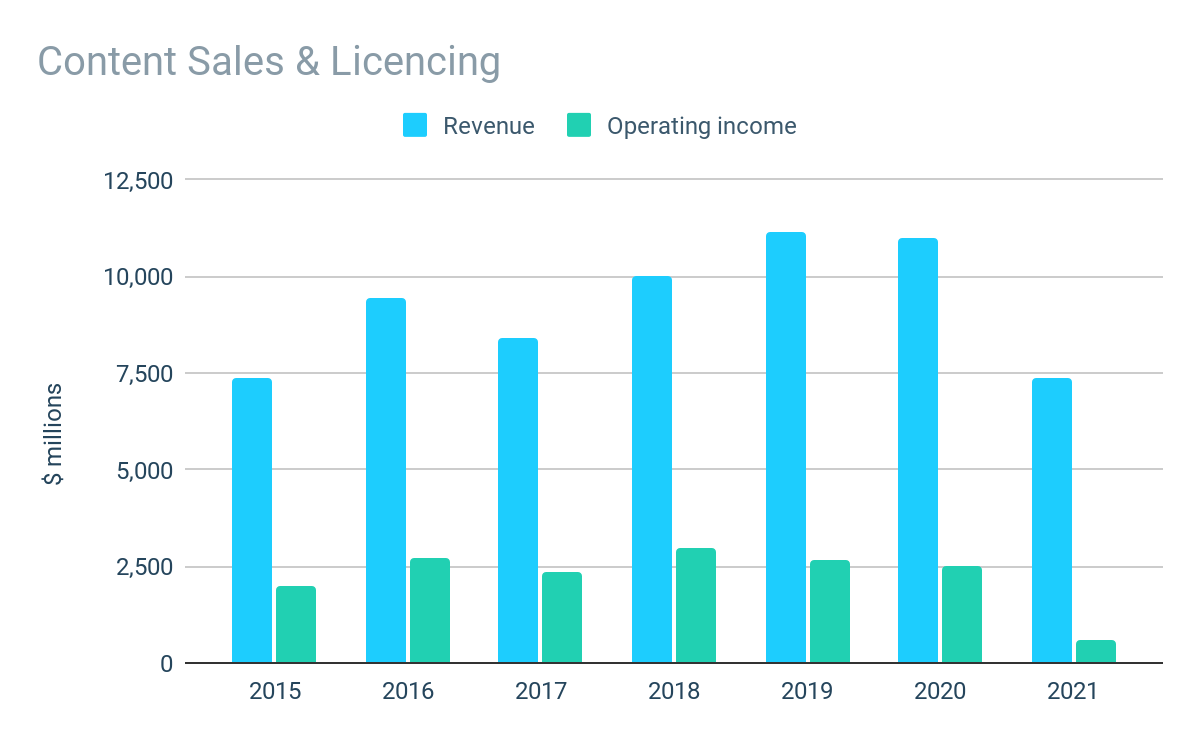
Prepared by author. Data from company reports.
Prepared by author. Data from company reports.
Prior to the pandemic, revenues had been growing and margins were consistently around 30%. Results in 2020 were relatively resilient despite the pandemic, with the disruption to theatrical movie release schedules being felt. However, revenues in FY21 fell by 50% from an already reduced level in the prior period. Results for the first 9 months of FY23 suggests the segment is on the road to recovery, with revenues up over 20% and operating profits of $0.6 billion compared with a loss in the prior period.
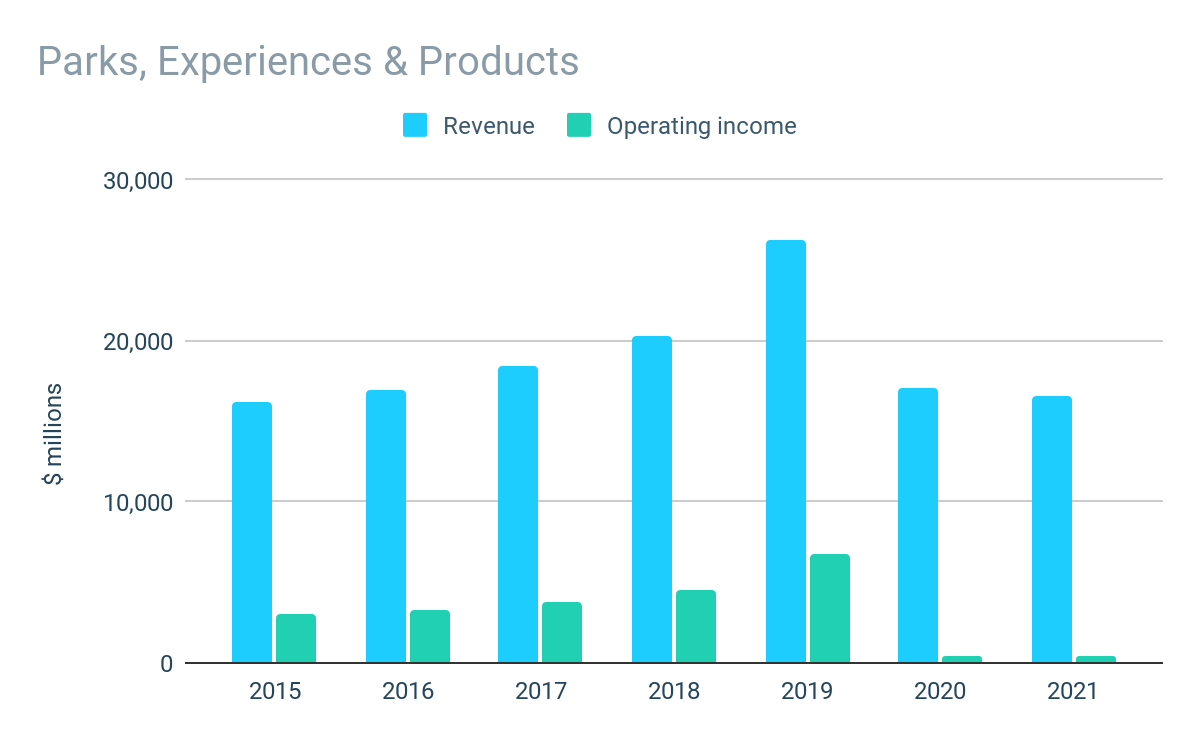
The PEP segment includes the company’s theme parks and resorts, Disney Cruise Line, and Disney Vacation Club, as well as consumer products which it sells directly or licenses to third parties.
Prepared by author. Data from company reports.
Prepared by author. Data from company reports.
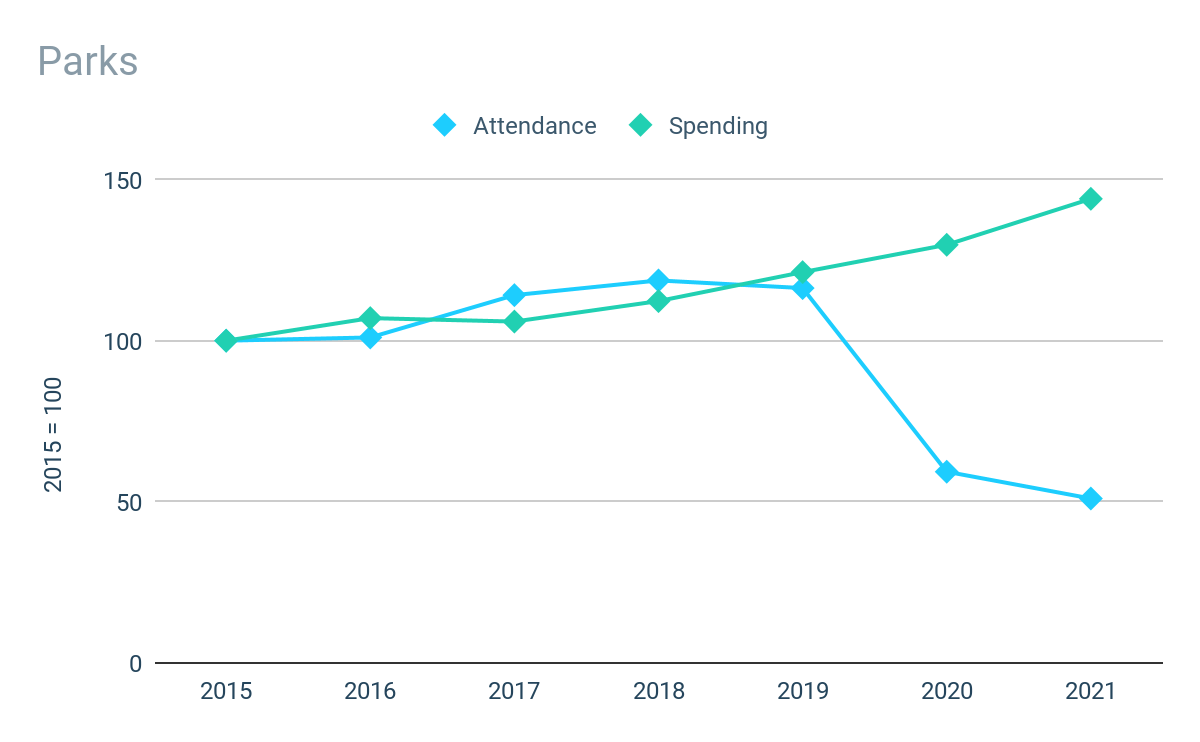
Note: Disney does not report absolute figures for attendances or spending.
Revenue from theme park admissions and related sales (merchandise, food, beverage and resort stays) represent the vast majority of revenue of the PEP segment, meaning park attendances and visitor spending are a key performance indicators.
Attendance at the company’s theme parks had been growing since 2015, albeit this had tailed off slightly in 2019 before the parks were impacted by closures and/or restrictions in FY20 and FY21. Average per capita guest spending continues to grow strongly with average growth in the region of mid-to-high single digits annually. The company reports higher guest attendance in spending in its results for the first 9 months of FY22 compared to FY21, though no figures are available.
Prepared by author. Data from company reports.
Prepared by author. Data from company reports.
Pre-pandemic revenues and profits of the PEP segment had been growing consistently, with profit margins consistently at or above 20%. In 2020 and 2021, revenues were relatively robust given the significant disruption caused by pandemic. However, due to the large overheads of these businesses, profits were completely wiped out. The Parks business has recovered strongly in the first 9 months of FY23, with revenues up over 90% compared to the same period last year, while operating income was over $6 billion compared to a small loss in the prior period.
Prepared by author. Data from company reports.
Prepared by author. Data from company reports.
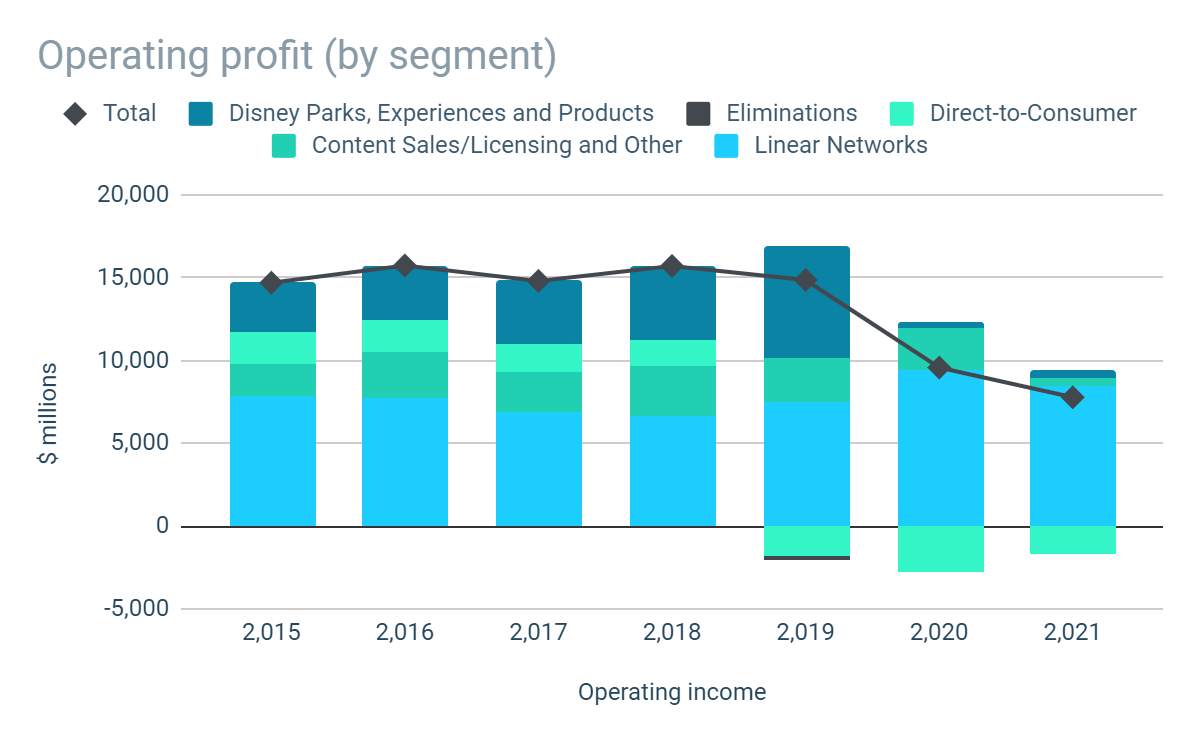
On a consolidated basis, segmental operating profits had been broadly flat at around $15 billion p.a. since 2015. Since then, operating profitability has declined significantly falling below $10 billion in FY21.
Given the major disruptions the company has faced, the decline is not unexpected and not a reason for major concern. In fact, the ability of the company to maintain the profits that it has done during the pandemic is testament to its resilience – and highlights the importance of the Linear Networks, which are given much less attention than Disney+ but consistently contribute significant amounts to the bottom line every year.
Prepared by author. Data from company reports.
Prepared by author. Data from company reports.
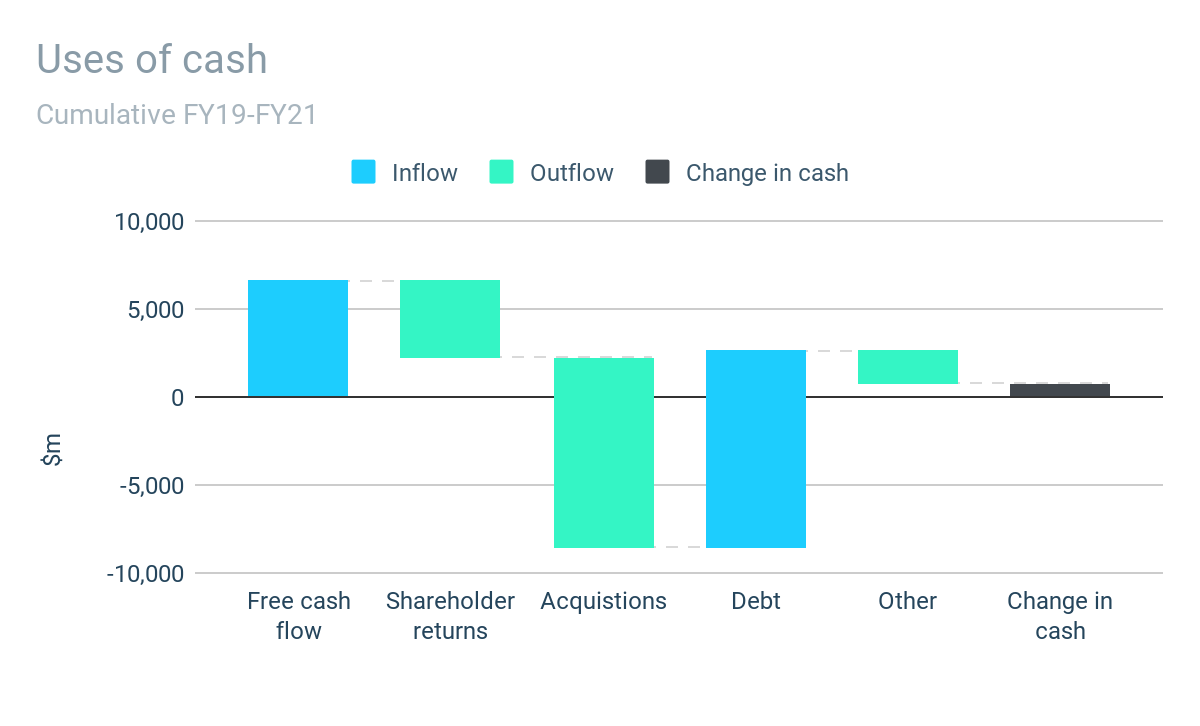
Despite the many headwinds experienced in recent years, the company has continued to generate positive free cash flow in each of the last three years. Across the period FY19-FY21, the company generated cumulative free cash flow of almost $7 billion, which is well below the historical norm.
The majority of the company’s free cash has historically been returned to investors, through an ongoing progressive dividend and ad-hoc repurchases. However, the dividend program was paused during FY20 and has yet to be re-continued, while no repurchases have taken place since 2018.
Prepared by author. Data from company reports.
Prepared by author. Data from company reports.
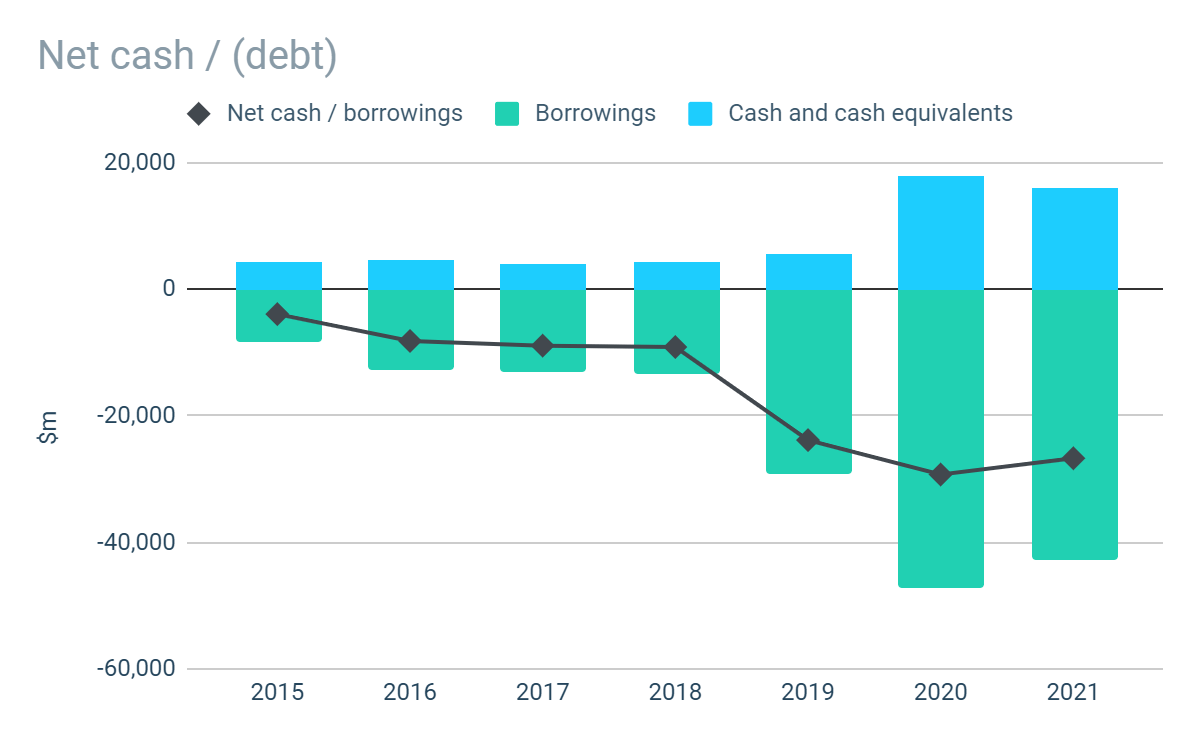
The acquisition of TFCF in 2019 was funded approximately 50:50 with cash and shares, with the cash element financed in part by issuing debt. As a result, the company’s net debt has almost tripled from $9 billion pre-acquisition to $27 billion at the end of FY21.
Even so, it remains entirely manageable. At FY21 EBITA levels, the company’s net debt represents a leverage ratio of over 5x. However, at “normalized” pre-pandemic levels (based on FY19 results) it represents leverage of less than 2x.
At $70 billion, the acquisition of TFCF was a significant investment by the company. Since the acquisition, the company has experienced a period of challenging trading conditions which has made it difficult to assess the impact of the TFCF acquisition, and it is unclear to what extent the acquisition can be considered a success at this point.
Disney+ was launched in 2019 and has attracted more than 150 million subscribers to date. While we expect the service to be a long-term success, it continues to be loss making, has yet to be proven whether the model can be profitable, and the long-term impact on its linear channels is unclear.
As of 21 September 2022, the company’s shares trade at around $107, giving the company a total market capitalization of $195 billion. Excluding the company’s cash reserves of $13 billion and investments of $3 billion, this implies a valuation of $179 billion for the operating businesses.
Our approach to valuing operating businesses is based on determining the true underlying earnings power of the business or “owner earnings.” Determining this in the case of Disney is difficult given the acquisition in 2019 followed by challenging trading conditions experienced in the following years.
Based on FY21 adjusted net income – which excludes restructuring costs, impairment and amortization of intangibles – the operating businesses are valued at around 37 times earnings. However, adjusted net income in FY18, prior to the pandemic and the acquisition, of just over $13 billion, represents a much more attractive price-to-earnings ratio of 14 times.
On the basis that FY18 earnings are a better proxy for underlying profitability than FY21, assuming modest annual earnings growth of 3% – 7% in the next decade implies annual compound returns in the range of 9% – 15% (including dividends).
It is reasonable to argue that Disney’s current true underlying earnings power is actually higher than this given the business is significantly larger following the acquisition and has successfully launched its own DTC streaming service, which is on track to become profitable in the next financial year.
Due to the challenges in recent years, it is difficult for investors to assess the true underlying earnings power of Disney. Earnings have been depressed and the company’s valuation metrics have become unattractive to investors.
There is reason to believe that FY23 could be the year that Disney returns to its full glory, should the state of the wider economy hold up. The impact of Covid-19 should have almost entirely faded away (perhaps with the exception of China) and there is hope that Disney+ will achieve profitability. There is also scope for the dividend to reintroduced. Increased earnings, lower valuation multiples and the prospect of reliable dividend income would massively increase Disney’s appeal to investors – and therefore its price tag.
I am a long-term holder and will continue to do so at the current price. Should the price fall by even a little, then I can see good reason for my rating to move from “hold” to “buy.”
This article was written by
Disclosure: I/we have a beneficial long position in the shares of DIS either through stock ownership, options, or other derivatives. I wrote this article myself, and it expresses my own opinions. I am not receiving compensation for it (other than from Seeking Alpha). I have no business relationship with any company whose stock is mentioned in this article.
