THE WOLF STREET REPORT
Imploded Stocks
Brick & Mortar
California Daydreamin’
Canada
Cars & Trucks
Commercial Property
Companies & Markets
Consumers
Credit Bubble
Energy
Europe’s Dilemmas
Federal Reserve
Housing Bubble 2
Inflation & Devaluation
Jobs
Trade
Transportation
The housing market is going through some navel gazing, as many buyers evaporated at current prices and mortgage rates. They’re still out there, but they’re a lot lower, and many sellers haven’t figured that out yet, though some started cutting their asking prices but not nearly enough, and deal volume has plunged.
Sales volume of existing homes plunged by 20% from a year ago across the US, and by 31% in California, and by 41% in San Diego. Median prices in the West have begun to drop, and in the San Francisco Bay Area fell below year-ago-levels, including by 8% in San Francisco. Sales of new houses plunged by nearly 30% year-over-year across the US, and in the West by 50%, as the supply of new houses has exploded to 11 months, the highest since the peak of Housing Bust 1. And big institutional buyers have started to pull out of this market because they don’t want to overpay. This has been going on for months.
But today, the S&P CoreLogic Case-Shiller Home Price Index, which lags reality on the ground by 4-6 months, finally picked up the first month-to-month price declines – all of them in the West: the metros of Seattle, San Francisco, San Diego, Los Angeles, Denver, and Portland.
Today’s release of the Case-Shiller Index was for “June,” which consists of the three-month average of closed home sales that were entered into public records in April, May, and June, of deals that were made a few weeks to a couple of months earlier, roughly in March through May.
By mid-April, the average 30-year fixed mortgage rate pierced the 5% mark and has stayed above 5% ever since. So here we go.
Seattle metro house prices dropped by 1.9% in “June” (three month moving average of April, May, and June) from “May,” wiping out in one month the gains of the prior two months plus some. This was the first month-to-month decline since October 2019, after a totally ridiculous spike. It chopped the year-over-year spike down to 9.3%, from 27% a few months earlier.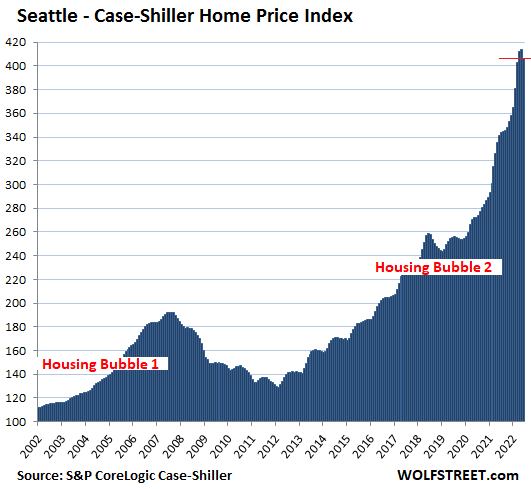
San Francisco Bay Area house prices fell by 1.3% in “June” from May, below the level of April, and the first month-to-month decline since June 2020, wiping out in one month the gains of the prior two months. This whittled down the year-over-year spike to 16.1%, from over 24% in prior months.
For the Case Shiller Index, the metro consists of the five-counties covering San Francisco, part of Silicon Valley, part of the East Bay, and part of the North Bay.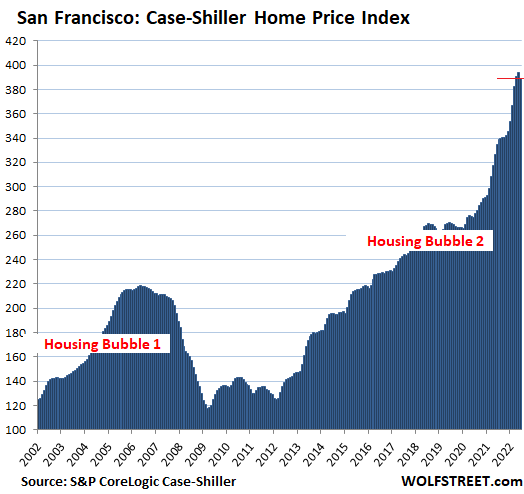
San Diego metro house prices fell by 0.7% in “June,” the first month-to-month decline since October 2019, after a ridiculous spike. The index dropped below the April level, thereby wiping out in one month the gains of more than two months.
This 0.7% decline reduced the year-over-year gain to 21.6%, from the near 30% gains a few months ago.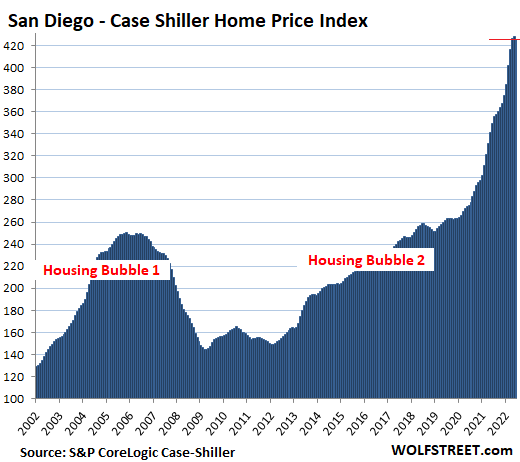
The index value of 425 for San Diego means that home prices shot up by 325% since January 2000, when the index was set at 100, despite the plunge in the middle (CPI inflation amounted to 75% over the same period).
Los Angeles metro house prices fell by 0.4% in June from May, which whittled the year-over-year price spike down to +19.4%.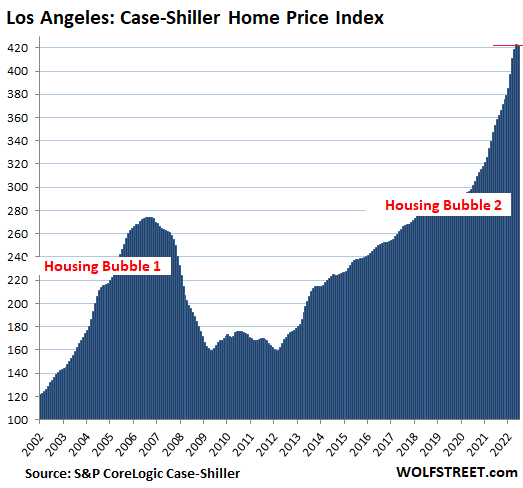
Denver metro house prices dipped 0.1% in June from May, whittling down the year-over-year gain to 19.3%: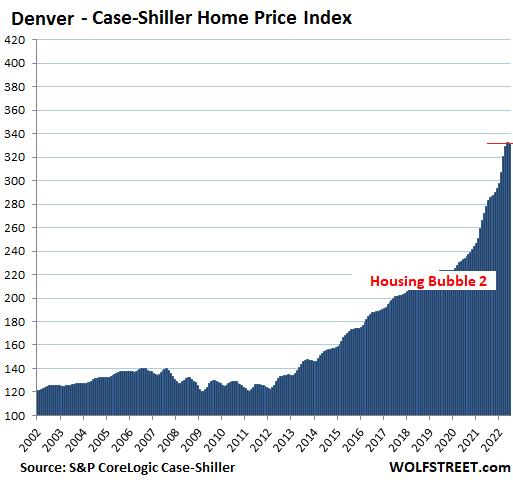
Portland metro house prices dipped 0.1% in June from May, which whittled down the year-over-year gain to 14.7%. The month-to-month dip, the first since October 2019, is too small to mark on this 20-year chart: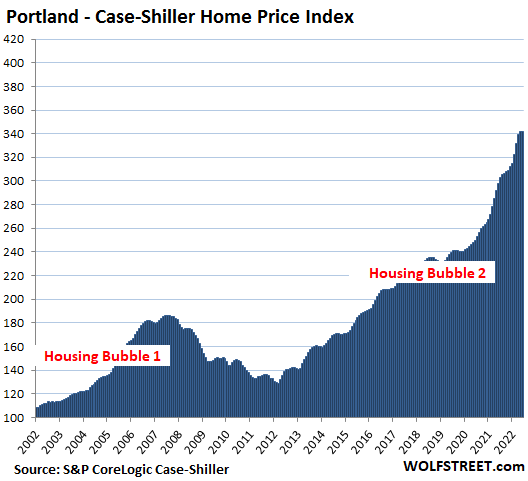
House price inflation. The Case-Shiller Index uses the “sales pairs” method. The sales in the current month are compared to when the same houses sold previously. The price changes within each sales pair are integrated into the index for the metro, and adjustments are made for home improvements (methodology). In other words, the index tracks the change in dollars it took to buy the same house over time, which makes it a measure of house price inflation.
Miami metro: +2.3% for the month, “decelerating” from month-to-month gains in the 3.5% range in prior months. This whittled down the year-over-year gains to +33% from +34% in the prior month, ridiculous mania, all of it.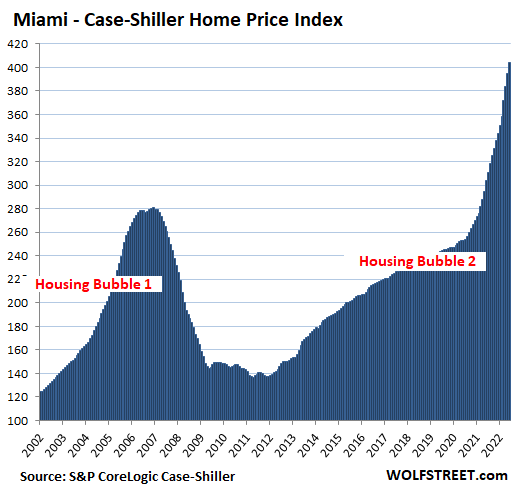
Tampa metro: +2.2% for the month, decelerating from 3.7% earlier this year. This whittled down the year-over-year spike to 35.0% from 36% in the prior month. Mind-blowing crazy.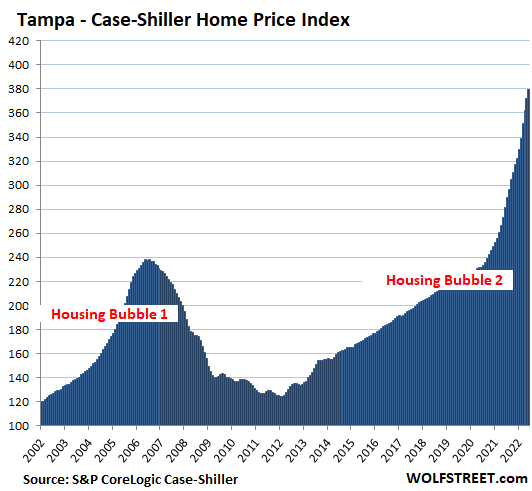
Phoenix metro: +1.0% for the month, decelerating from +2.5% in April, and from +3.0% earlier in the year. This whittled down the year-over-year spike to +26.6% from +32% earlier this year: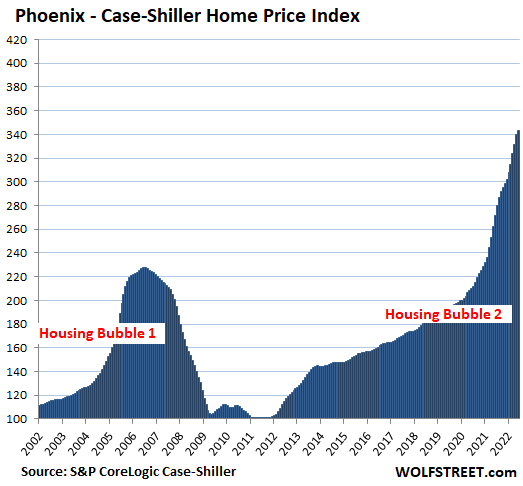
Boston metro: +0.6% for the month, decelerating from 1.9% in the prior month, and from +2.8% earlier this year. This whittled down the year-over-year gain a tad to 14.9%: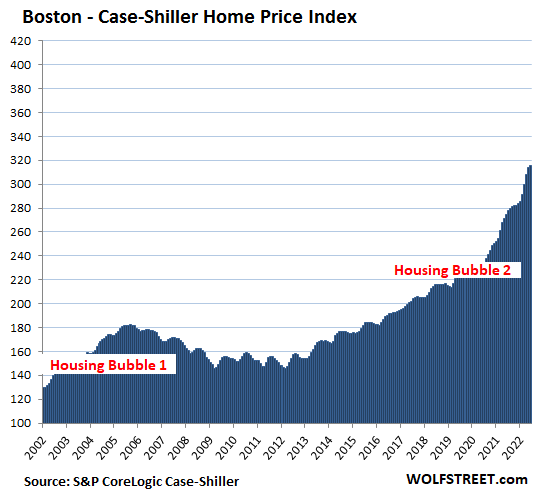
Washington D.C. metro: +0.0% for the month, no change, decelerating from 2.9% earlier this year. This whittled down the year-over-year gain to +10.8%: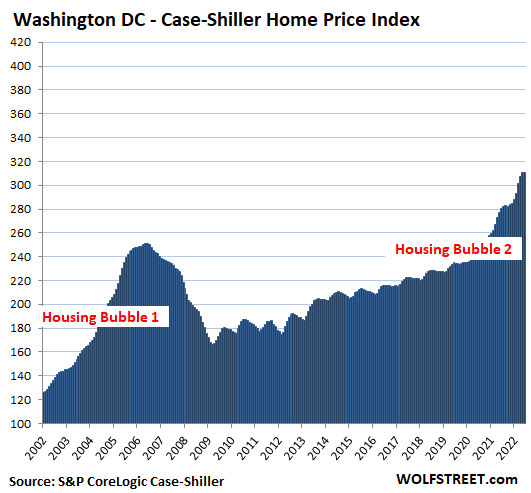
Las Vegas metro: +1.5% for the month, decelerating from +2.1% from the prior month, and from over +3% earlier this year. This whittled down the year-over-year gain to +25.1%: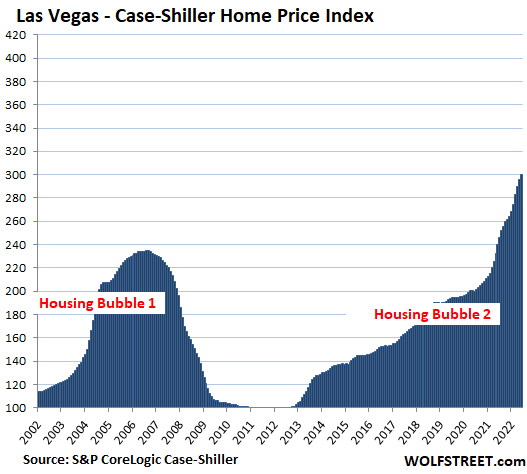
Dallas metro: +2.6% for the month, same as in the prior month, but decelerating from over +4% earlier this year. The year-over-year gain remained at +30.8%: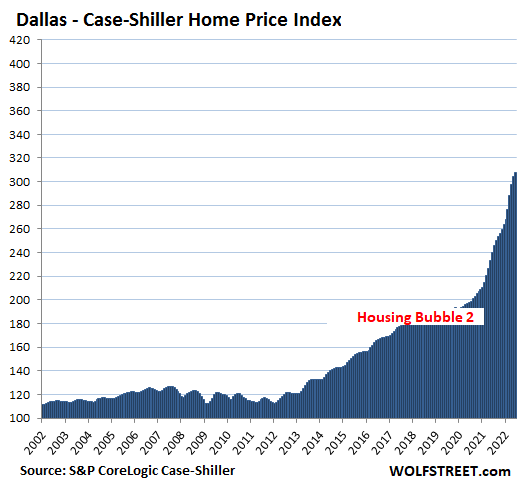
New York metro, the huge market within commuting distance to New York City: +1.1% for the month, decelerating from 1.6% in the prior month. The year-over-year gain of +14.6% has been roughly unchanged for three months.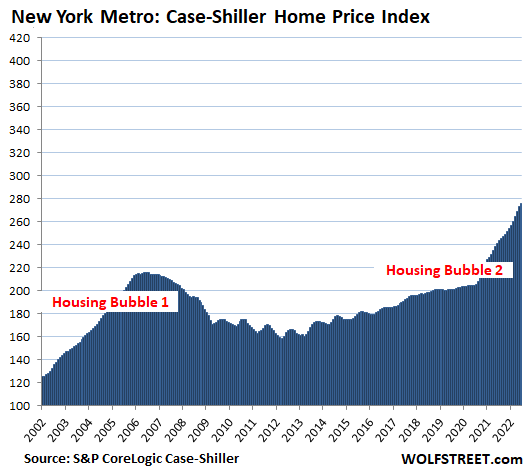
With its index value of 276, the New York metro has experienced 176% house price inflation since January 2000. The remaining cities in the 20-City Case-Shiller Index (Chicago, Charlotte, Minneapolis, Atlanta, Detroit, and Cleveland) have had less house price inflation and don’t qualify for this illustrious list.
Enjoy reading WOLF STREET and want to support it? Using ad blockers – I totally get why – but want to support the site? You can donate. I appreciate it immensely. Click on the beer and iced-tea mug to find out how:

Would you like to be notified via email when WOLF STREET publishes a new article? Sign up here.![]()
Email to a friend
Great data! Thank you!
It appears the peak has been reached in this insane bubble.
However, with a son who wants to buy a house, a 0.1% decrease hasn’t motivated him to leap off his comfy couch yet.
This will be interesting for the rest of the year.
Seattle’s got a bigger drop, no?
Why this data is not published live like stock trades? Why a delay of 4 months?
More transparency will help both buyers and sellers have real expectations and help RE agents close sales faster.
Today, the market in West is freezing due to big price expectations between sellers and buyers.
Yes, it would be nice to have this type of data (sales pairs) in real time.
You can get the data in real time just by looking at random listings on Realtor, HAR, Redfin and Zillow. You prob won’t know the final sale price of the listings you favorite, but it at least gives you an idea. Chances are real good At this point that none of the listings are going above asking.
Sales pairs relying on public records is going to have a lag associated with it. As a real-time proxy you can use average sales price movement published by various entities which rely on MLS data. That more current data has been showing a definite reduction in housing prices on a national level, with a lot of variability between regions (a trend which the Case-Shiller has picked up as well).
Thanks Wolf.
DjReef, looking at random listings doesn’t work in Seattle area as listed prices are crazy high as these are still based on April. However RE agents, who really want to make sale, are themselves advising that the house will sell for 20% – 25% less. Remember 1.9% monthly drop is 23% annual drop, and it’s just getting started. Simply mirror the S curve and it’s easy to guess a 33% annual drop.
Also, please note a conflict of interest. Approaching a RE website for house value os like Approaching a stock broker for stock value.
Max Power, average sales price carries 2 risks : 1. It’s not a sales pair and the mix of Houses can change as crappy properties don’t sell in a correcting market. 2. In Seattle, huge credit is now paid by seller to buyer to prevent sale prices to plunge. This is specifically true for builders who are looking at 12+ months of inventory.
I get nose bleeds reading your home price indexes!
“Seattle’s got a bigger drop, no?”
If it keeps the idiots away, good…
I live in Seattle, and in arguably the neighborhood that has seen the greatest price increases (bubble). I has definitely slowed down, but a duplex down the street just sold for 1.5mil and it needs work. The real bubble is all these 6 story skinnies being build where there used to be a single family house like mine. There will be an enormous collapse in that market to the tune of literally giving these small units away – unless the City uses my tax money to buy them all and house all the drug addicts. There are also several 400-ft (that’s the zoning height limit) towers that are not sold on Denny, and I believe will be half empty when the dust settles on this colossal bubble. Amazon and Google employees no longer have all that RSU money to throw around.
It has been a while since I posted here. But I continue to see price drops everywhere in Seattle area. Especially for the million dollar plus houses. The number of million dollar houses for sale vastly outnumber the number of buyers that still have that budget. So far the trend I am seeing is that sellers come down some and then cancel the sale and put it for rent. Most sales are happening under million dollar range. You take any million dollar house and chances are very high that it has had some price drop. If i had to quantify – most high priced houses have seen a drop of average 20% to 35% from the peak.
Don’t get me wrong. I am not saying that zero sales are happening. Some houses are still selling at or near peak prices which was April/May. But now they are a minority. And tech stock rally has fizzled out. Rates are back near 6%. Fall is on the way. Once tenants renew their leases and settle down for the year, this fall and winter are set to deliver a deadly blow to house prices in this area if stocks and rate continue on the same path.
I’ve been seeing price reductions since May here in the South (TX) and have posted here, as such. Most started out $5-$10 grand, but now they’re dropping $20,000-$50,000 depending on the starting price and location.
Yep, that’s how these things always go. The sellers haven’t yet internalized that the market has changed. So they mentally can’t bring themselves to sell a house for 20% less than they could have sold it for in February. That’s why these adjustments always take time. There needs to be time for the “peak prices” to be far enough in the rear view mirror that the sellers don’t have that mental block.
It’s one thing to say “I won’t sell for $800,000 today when I could have gotten $1,000,000 in February” and quite another to say “I won’t sell for $800,000 today when I could have gotten $1,000,000 two years ago.” In the latter, the sellers have realized that they missed the opportunity, in the former, they haven’t yet, it’s too recent.
These sellers will eventually come around. There aren’t enough renters out there to pay the owners the premiums they’ll demand for being a landlord and the hassle that comes with it. And most people did NOT buy during the 2021 peak, so they’ll still make a profit, just not quite as big as they would have.
I think all the “Seattle Techies” are at Burning Man.
Reality will hit hard.
Lack of water will make property in CA, AZ & NV worthless. A literal “forbidden zone”
Ted,
No, that’s a misconception about who uses most of the water.
Households use only a small portion of the water. In the densely populated coastal areas of CA, desal will become more common, but that’s expensive water.
Waste water recycling will also become more common (in CA, after treating the waste water, it’s injected into an aquifer for natural filtration and purification before it becomes tap water from the aquifer). But this is also expensive water.
And industry uses quite a big of water (from the car wash to the power plant).
Agriculture uses about 80% of the water in CA, and without water, or with expensive water, food is going to get a lot more expensive, including in the rest of the US where CA ag products are exported to. FOOD production is the real issue with droughts.
What I see happening in my home town is enviros using the courts to slowly strangle water supplies at the local level. Even though most water, on the aggregate, is used by farms, the economic impact is felt by residential rate payers through increased water rates.
In Santa Rosa, its gone up 17% since 2015 with a further 10% cumulative scheduled for the next 3 years. Install all the low flow toilets and shower heads you can, but at some point lifestyles get impacted and the middle class gives up the ghost and moves out. No wonder home prices skid as the locals figure out the water and power game and realize the high paid tech workers wont be there to rescue them when its time to sell.
Denver is still lagging with drops. However, there is more inventory.
He is patiently waiting on his couch (and doing his income thing since I forwarded this to him).
Denver didn’t experience a massive bubble in 2008. Denver is certainly not immune this time. I expect 10-20% drops in prices.
Sellers in Boston area and Cambridge/Brookline think old dilapidated dated money pit condos are worth one million. Newsflash NO 1st time homebuyers (aka 2 millennials with 200k or above combined income) are even REMOTELY interested — based on my unofficial study of friends/colleagues.
I follow houses in two of my potential next hometowns (one in CA and one in FL). I just browse Trulia and “like” a few dozen houses at a time. Then Trulia automatically emails me when something changes like a sale or price change. For the past month, I’ve been getting nothing but price drop emails, and there are some doozies! But the thing that really stands out is that most of the price drops came when a listing went from pending sale to active. Seems like a deluge of cancelled sales. Anyway, other than drumming up the obvious question of, “How the F could you be contemplating a potential move to CA and FL at the same time?”, I just thought I’d share my anecdotes.
I would go with Florida. I heard they don’t have any COVID over in that state.
Why don’t you move to WA state so that I can sell you my house at $3 million and then buy it form you after 1 year at $2 million.
Believe me, you will be ready to sell your house at $2 million after 1 year when you realize how crazy expensive and unsustainable this place has become despite no significant rise in incomes. The administration has lost touch with real problems.
Preach it! Glad mine sold last month!
Sounds like the deal of a lifetime! Where do I sign?
But seriously, I also should have mentioned that I don’t actually intend to buy anything. I move around a lot and prefer to rent. As a potential house renter, the relative desperation in the market will probably affect rents. Hence my interest.
I live in Florida and there’s plenty of COVID here. Lol. The market here in Tampa is still crazy, even though we’re beginning to see the prices slashed. There’s nothing here for first time home buyers, prices are still off the chart.
Marcus1,
I live in Southern California. In the last month I have noticed a lot more open houses out here. I get the feeling that sellers are getting anxious… then again maybe I’m reading too much into it?
I used to live in La Jolla. Looking at my old condo, the rent has gone through the roof and units for sale have been listed at more than double what they were a few short years ago. I was never happier than living there, but things need to settle down a lot before I would return.
I lived in La Jolla for a handful of years and loved it as well. I’ve been pretty fortunate to have sold a house in 2017 for a 35% profit then sold another house 2 months ago for 50% profit. I’m sitting on the sidelines with a pile of cash waiting to buy again. I think we are about a year out from really good action!
I’m in Mission Viejo and keep my eye on the surrounding cities as well. The inventory here had a huge spike during July and early August, with tons of price drops and virtually nothing selling.
Over the last few weeks I’ve noticed a much slower rate of homes coming on the market. Price drops are still common. But a fairly significant number of homes are going into Pending and Under Contract status.
Yet, very little is appearing as Sold (it may just be that the sales haven’t completed). There are A LOT of Back on the Market homes though.
This will be a slow process. Most homes here at current listing prices, even with a 20% down payment, will have monthly payments over $7k per month.
I can say that Cleveland population distorts numbers for Ohio. It has been in steady decline and Columbus, the capital of Ohio, has a larger population. Due to the CHIPS deal, our residential RE has gone insane. The local NREA are saying we are insulted from any bubble. Cleveland numbers do not compare. Why does CSI still use them?
I wouldn’t get too overconfident about the CHIPS deal insulating the housing market in Central Ohio. The Portland metro area has the largest concentration of semiconductor jobs in the U.S. with a new fab being built every 5 years or so since the 90’s. When they build out the Ohio fab many of the high tech bits will come from the burbs of Portland as well as all the engineering and R&D ( Intels motto “copy exactly) but that did not stop a housing slump in 2008 and it won’t stop it from happening in Oregon as well as Ohio.
I live in Columbus and can tell you there is a huge difference with the housing market here and that is the prices. I signed the contract to buy my 3 br home literally days before the lockdowns so I managed to get a prepandemic price with early pandemic interest rate, and I paid $150k. After two years of runaway housing bubble my home is now estimated to be worth an astonishing, eye watering, unbelievable… $200k. Meanwhile wages seem to be rising faster here than the national average based on my very unscientific observations of the signage on every business that say they’re hiring. There are fast food restaurants here, in a city that still has plenty of $200k housing, advertising $15hr wages. A couple of young Chick-fil-A workers could hitch up and most likely afford to buy my house right now. And we are looking at something like 3000 new jobs from the Intel plant alone, plus potentially more from suppliers that could locate here, all at WAAAYY higher wages than the local average. I’d say there is about a snowballs chance in hell that prices fall back to 2019 prices in Columbus. Not completely impossible, but highly unlikely.
I see no new SFH builds in C-bus for 200K unless you are talking south past Grove City. Most things around the beltway are starting over 350K for new builds. All areas near the CHIPS are starting in low 400K. Yes, our Papa Johns drivers can start at $22 hour, but mortgage companies are sticky on those jobs.
Glad to hear that the Cali housing disease hasn’t infected CLE. Very sorry to hear about Columbus. Idiotic behavior in housing is bad, not good. I’ve watched it destroy towns on the west coast. Hopefully the Intel effect will be brief and things will calm down. I’m sure people there think the Intel boondoggle is a good thing, and it certainly could be, but if it drives housing prices beyond what the locals can afford, that would be very bad for the community.
Seattle / Portland RE peaked in 2008 and troughed in 2012…..roughly 4 years. Since history rhymes, we can expect the next trough in late 2026…..possibly at the previous 2008 peak. Are these charts denominated in nominal dollars? Inflation adjusting the squiggles encourages suicidal behavior.
That was 2 years after the unemployment rate peaked in 2010.
nsa,
The chart shows the Case-Shiller from 2002 to 2022.
The index measures the change in value of U.S. single-family homes on a monthly basis.
For many years my wife was a firm supporter of market prices. “They are what they are”, she often said, to justify interest in a high-priced home she was looking at. After seeing the ridiculous price spike in 2020 and 2021 in the West, she’s finally accepted the notion that the housing market might be speculative in nature, and you can lose a lot of money if you buy at the wrong time. Attitudes have changed.
She must not have been paying much attention during the last 30 years
Cognitive dissonance.
Agree with the bubble idea, but….
this is different this time because of two things
1. Replacement costs are sharply higher.
Materials and labor.
Bubbles that popped in the past did not have this.
2. Mortgage rates STILL well under the inflation rate. Bubbles that popped in the past did not have this.
1) Market price of X is determined by the balance of supply and demand for X not the sunken cost of producing X or the cost of replacing X.
During housing bubble 1, surplus houses were demolished (i.e. were worth less than zero) due to lack of demand. Similarly for houses in blighted parts of cities like Detroit and Baltimore. The market value of empty office towers all over the US is less than the cost to build / replace them since there is no demand for that space today.
2) The typical mortgage is held for 5-10 years so the real mortgage rate should use the expected inflation rate for next 5-10 years (approx 2.7%) not the current inflation rate of 8+%. By this measure real mortgage rates are approx. +3%
“the expected inflation rate for next 5-10 years (approx 2.7%) ”
is this a post from J Powell?
Replacement cost IS a consideration in determining value. SQ FT construction costs all time highs….still.
I think I have heard that somewhere before , “different this time”
You’ve used replacement cost as a reason in prior posts. You were wrong then and you are still wrong now. See the post above mine.
“Real” mortgage rates are irrelevant. Buyers pay housing costs with nominal dollars, out of their income and savings. Wages and incomes aren’t hardly ever indexed to inflation either and when it is, not exactly to the arbitrarily determined CPI index generally used as the measure of inflation.
It’s always different in the sense that it’s never exactly the same as the last time. It’s never different in the sense that those who participate in a bubble or mania are going to be exempted from reality, the reality of declining or crashing prices.
Housing (the structure) is a consumer good with a long shelf life. If you live in it, it’s not an “investment”. Claiming it is one is a rationalization, usually to “justify” paying more or buying more house to consume than the buyer needs.
Anything will appreciate measured in a depreciating currency if the currency debasement is big enough, like used toothbrushes which presumably increased in value back in 1993 in Brazil on my last visit when inflation was 40% per month.
Is this a sign of things to come in places other than the west coast? I hope so. I’ve seen prices double in many areas of New England the past few years and while homes are staying on the market longer, prices have barely budged.
Housing bubble one looks like nothing compared to housing bubble two in a lot of these charts. It’s stunning.
Lucca,
I was thinking the same thing. I’m scrolling like a mad man back and forth between the charts. For example, Dallas didn’t even have a bubble #1.
A big reason why these charts look stunning when you compare bubble 1 and bubble 2 is because the scale of these charts are linear and not logarithmic. To explain this in plain English, a move from 100 to 200 does not look as impressive as a move from 200 to 400, although they both represent the same doubling in price. This visual distortion is what tricked me into never considering the biggest housing bubble in California since the 1970s. This occured from 1975 through 1990 when housing prices increased 5.4x!
Having said that, these charts are still impressive and I believe that as long as Powell continues to push interest rates higher to fight inflation, putting upward pressure on mortgage rates, we will continue to see a downtrend in the housing indexes.
beatleme,
Hahahaha. Sure enough, got another one who wants to hide reality. In finance and real estate, every time someone clamors for log charts it’s to HIDE REALITY. Reality is hard to stomach sometimes, but hiding it with log charts doesn’t make it go away. Log charts in RE and finance are just an intellectually elegant way of lying about reality.
Overlaying a Median Home Price / Median HH Income might be interesting on those charts.
In terms of what you get for your labor, housing, stocks and bonds hit all time highs thanks to Fed policy. Now the Fed is going to make you look foolish if you bought any of these this year.
I’ve been saying that since S&P 3,000 or so. Those prices are only justifiable if interest rates were to remain 0 forever. Since that isn’t possible without eventual massive inflation, as we’ve seen, prices were not justifiable.
Ultimately, no one is willing to lend money out for free unless the government is distorting the scale. Thus, any asset price that assumes money is free forever is eventually going to implode.
Asset prices (including housing) are inflated mostly due to increasing debt which is only possible because of artificially low rates and (sub) basement credit standards.
This is readily apparent on a long-term chart of debt/GDP (which is also inflated by debt) and household net worth/GDP (or incomes). Both ratios have increased noticeably over time, accounting for most supposed increased “wealth”. Same thing with accounting bookkeeping entries known as earnings which are also substantially inflated by increasing debt and which make the actually meaningless P/E ratio look reasonable.
The country isn’t actually that much wealthier.
Mr. Frost, in spite of the run-up of valuations, from the debasing of currency and amped-up debt, the “standard of living” of Americans has certainly improved. You’d have to ignore the improvements in the quality and convenience and the increased quantity of material possessions, to argue against it.
This is not to say that we aren’t hitting the wall on the consumption of resources.
I think that Cali imploded first during hb1. Maybe somebody here can confirm or deny if that is correct. Cali could be the canary. The market is obviously turning down.
SocalJohn,
I think the canary should be Phoenix, Las Vegas, and Dallas.
Probably South FL too. Many of those buyers are from “periphery” (Latin) markets which should be impacted by tightening credit conditions at least as much as the US if not substantially more.
Elsewhere, I still expect previously and currently “gentrifying” areas to fare worst. Frequently or disproportionately undesirable areas to live but with close proximity to the core.
No joke, opendoor + offerpad own ~10-12% of homes on the market in the Phoenix area. They basically own at least one home in every neighborhood in the metro area. Imagine the power their behavior alone has on home prices, which are determined at the margins.
They were paying top dollar for many months then turning around and listing for even high prices.
Brilliant business model as long as prices are going up. Now they appear to be the quickest to lower their prices.
The last bubble canaries were Phoenix and Las Vegas. They dropped 50% by the end. Resort areas also plummeted.
The current canaries should be still Phoenix and Las Vegas. Also add in Boise, Denver, ABQ, and Salt Lake City since they have experienced the bubble this time. Also any resort areas. They deflated quickly during the last bubble. Key West, Outer Banks, NJ Shore, Tahoe, Mammoth, Colorado Mountain ski towns, Utah ski towns.
California definitely took it hard on the backside during housing bubble #1. As a bay area native, I saw homes go from for example 8-900k all the way down to 400k. Literally half of what they were in peak 2005-2006 prices. It was brutal here. The tech sector seems to be the last group of morons to know that their investments are losing value, but the first to take it in the shorts.
Anecdotal, but I have a teacher friend who purchased in 2010 in Mountain View.
Prices then became affordable to her. Now she is a multi-millionaire on a public elementary teacher salary. Crazy or sane, you decide.
She has ultimate job security at this point. Nobody will take a job as a teacher at current house/rent prices.
Yes, San Diego and Rancho Santa Fe in particular peaked in late 2003. But it was the first city out of the gate after Greenspan cut rates post 9/11 with a 20% annual gain which up until that time was unheard of and I believe was on the cover of either Forbes or Fortune. I don’t think they are the canary this time, it’s whoever went nuts first, maybe salt lake city or boise?
Denver charts shows some insulation from bubble 1 as it was mostly unfelt however, the current one is another story. The market has been inflated for too long at too steep of a rate to hold and since the interest rate surpassed 6%+ the local market has tapped the brakes a bit. This slowing showed first in 1M+ properties and will slide into the 750K realm, in pockets. It will be interesting to follow over the next 2’ish years.
My son is sitting on his comfy couch waiting for the insanity to end in Denver.
I think prices will fall 10-20% within the next 4 years if history repeats itself. Inflation will rise 10-30% during this time like in the 80’s-90’s for home prices. It will be an equivalent 40% drop.
I am waiting on an intersection of Homeowners equivalent of rent CPI with Case Schiller. This happened in 2012 and then diverged.
I am not driving this train so if the Fed has other political pressure like in 2019, they may stop any drop in the housing market by lowering rates.
We live in a controlled economy for better or worse.
Here in Chicago NW suburbs many price cuts, many successive but only latest shown as “price cut” on Zillow listing. One went from contingent at $729k in May to $649k now, but only latest $20k cut shown on photo.
jm commented on Chicago NW suburbs …
Here in Dupage County it’s pretty similar. I’ve noticed price cuts since the beginning of June. But only the most recent ones appear on Zillow/Redfin.
We were lucky our unused, but available , 7-year HELOC was due to expire in June. We ‘renewed’ it for another 7-years (even though we’re hoping to downsize before IT expires). The appraisers estimate in April made me want to rush out and buy a Maserati … even though I would probably need a stairlift to get in and out of it. VBG.
My wife did let me buy us an expensive steak dinner out however.
anon:
Absolutely LOVED the, ”even though I would probably need a stairlift to get in and out of it. ”
Thanks for the very clear image of what some of us have begun to experience ALL too Clearly!
Had challenges far damn shore to decide if wanting to ”crawl down into vehicle” OR ”climb up into,,,”’
Finally found an older pick up truck that, so far, seems to have exactly the same space INSIDE while very clearly much smaller on the outside???
Not doubting that a crash can happen but it is going to require a lot more homes to be on the market. HB1 inventory was much higher at this point. Sales of new homes are up but inventory of existing homes are still historically low and showing signs of leveling off. Outside of a deep recession or some black swan event I see a crash in transactions and not in prices.
It doesn’t matter how many or how few homes are on the market if there are no buyers at these prices.
In my mid sized town in Minnesota, I see price drops everywhere and longer time on market. After the reduction of price, they are selling though. The higher prices homes are not moving like they were a couple years ago. Inventory’s are starting to build a little bit.
It’s not a bubble until it burst! The numbers on rental properties haven’t made sense in Chicago for years. It’s nuts.
I would like to see these bubbles adjusted for actual monthly payments on what they are buying. This may reflect lower prices at high rates and high prices at lower rates.
I used to comment on the splendid housing bubble series with the calculations for approx. monthly payments making certain simplifying assumptions (it’s complicated by tax considerations which vary quite a bit). But Wolf strongly disagrees with this methodology so I don’t do that any more.
However, you can look at the NAR’s Housing Affordability Index (HAI) to get a rough idea of where things stand today. HAI compares monthly mortgage payments (excluding property taxes and insurance) for the median priced home against median household incomes.
The latest HAI from NAR (for July) shows affordability at a 33 year low – lower than at any time during housing bubble 1.
I really don’t see a trigger for a fast hard housing decline until recession causes job losses. Really need a lot of job losses. That could easily be 6 months to a year away. Then it takes time for the rent or the mortgages to not be paid and the processes of eviction and foreclosure. It will take a while for all this to play out.
I see this as inevitable. The fed is no longer buying or replacing its MBSs under its QT plan. Coming soon, corporate earnings compression, leading to recession leading to job losses.
Job losses are really the key as far as I can see.
Then this could get really interesting. There are a lot of properties that were bought in the last few years by private parties, by flippers and renovators and private equity and pension funds.
Lots of homes bought with short term money by PE groups to rent. When the rent stops coming in? When the loans need to be rolled over for higher interest rates? Flippers won’t like the higher rates either.
It appears to me that a perfect storm is brewing and anyone who realizes it soon, may get out. As Wolf has shown, the prices have stalled and inventory build is already starting.
It could all happen faster than I think it will but most likely it will take 2 to 3 years or more to see a bottom. All depends on a lot of variables and that good ole human emotion > fear. When does worry and hope turn to fear?
Actually, the Fed has still been buying MBSs to the tune of about half a billion dollars per business day the past three months. That’s supposed to end tomorrow (unless they do some some sort of ‘taper’ down to zero purchases throughout next month).
Max Power,
You got this partially wrong.
MBS come off the balance sheet not because the mature (they won’t for years), but because of the passthrough principal payments from mortgage payoffs, refis, and mortgage payments, that are passed through to holders of MBS.
The Fed bought $100 billion in MBS in May before QT just to keep the balance level by making up for the pass-through principal payments that the Fed received on its MBS.
In August, it was buying about $7 billion. Passthrough principal payments have slowed a lot due to higher mortgage rates, but they’re still flowing.
If these pass-through principal payments, which are unpredictable, exceed the cap that the Fed put on the MBS runoff, the Fed will buy some MBS to keep the runoff below the cap. If the pass-through principal payments are less than the cap (expected to happen particularly later during QT), the Fed will not buy any MBS.
This sounds like a good plan for a soft landing.
People are not doing refi’s when they have a 2%-3% mortgage so the roll-offs have slowed.
People are not buying as many new houses. Not as many new loans.
Some are doing HELOCs at a higher rate to pull out all of the cash they can from their house. Either to live 🙁 or out of paranoia from 2008 so they can walk away with their cash, boat, RV, and mega-truck, while ditching their house to foreclosure.
There is a drag on the Fed income from MBS’s
The last thing the Fed wants is to have people walk away from their house and keep their Mega-Truck, RV and boat. They will control rates by controlling the MBS buys and using their super-computers to prevent this.
We saw this before in 2008 and that is not a soft landing.
em, I agree almost completely.
The Fed doesn’t seem to recognize bubbles forming until they’re truly obscene, but they sure as hell recognize (and will prevent or at least stop) crashes. I imagine that home prices will decline, but not a crash. The FED cannot allow stocks or major asset classes crash. There’s too much interconnectivity to let a significant asset class cave in.
This is basically the “Fed is going to pivot to help stocks” argument. I thought the Fed had disabused everyone of this notion in the past week.
You are grossly exaggerating the Fed’s convictions and the steadfastness of stock investors. Remember Graham’s warning that Mr. Market is manic/depressive. So is the FED, imo.
There is a global slowdown in growth and soon to be negative. Same goes for the U.S. For the FED to keep raising rates in spite of this is unfortunate as their cajones are caught between a rock and a hard place. But, if inflation takes a few downward turns, there will be no cigar for Mr. Powell, and he’ll be singing the QE blues.
It’s entirely psychological. Almost no one seems to ever consider that QE in Japan, Eurozone, UK, and anywhere else made minimal or no visible difference to stock prices. China didn’t do QE, but the country has been on a credit binge since 2008 and the stock market is still over 50% below the 2007 peak now. China’s credit expansion went elsewhere, primarily real estate for households.
I hope lying season finally comes to an end, voodoo accounting and slight of figures. It’s like a three ring circus sideshow every quarter. I don’t know how some of these companies can keep a straight face after they publish earnings some of these companies have purported to have made.
” I don’t know how some of these companies can keep a straight face ”
How about the SEC ?
Increased “risk off” can easily crash other asset classes such as stocks and junk bonds given how absurdly inflated these markets actually are now and for most of the last 2+ decades.
That will accelerate the real estate market weakness noticeably.
I live in Seattle, and in arguably the neighborhood that has seen the greatest price increases (bubble). I has definitely slowed down, but a duplex down the street just sold for 1.5mil and it needs work. The real bubble is all these 6 story skinnies being build where there used to be a single family house like mine. There will be an enormous collapse in that market to the tune of literally giving these small units away – unless the City uses my tax money to buy them all and house all the drug addicts. There are also several 400-ft (that’s the zoning height limit) towers that are not sold on Denny, and I believe will be half empty when the dust settles on this colossal bubble. Amazon and Google employees no longer have all that RSU money to throw around.
No surprise there all the money flowed in from Vancouver, Canada to Seattle when the Canadian government slapped a vacant home tax on empty homes in Vancouver.
The old adage “slowly and then suddenly” definitely applies to these charts.
Any analysis done on sellers just converting to a rental, which might keep prices high. Either sellers sell for their price or they rent it out and make a nice return.
With rent prices so high and very few places to put your money(stock market is very volatile right now and bond yields are negative), I can guarantee people are making the decision to get 7-15% yield on renting. If you bought before 2019 in any of the hot markets, your mortgage+tax/insurance +are going to be much lower than the current value of the rent.
As an example, buying a house for 200k a few years back, which is now “worth” 400k. That is 250k in equity give or take. 250k @ 3.2% 2 year treasury would give you 8k a year(being generous bc selling a home comes with fees etc so you wouldn’t get all the equity back). Only issue here, now the rent on that home is 2.5-3k a month, and my cost is 1.2k excluding maintenance. Conservatively, would give me between 15-21k a year.
Don’t think this has been discussed enough, rents are supporting these price levels in a big way.
It is useful to compare rent inflation with house price inflation.
Wolf has a good chart for that (but not in this article) showing house prices rising much faster than the official CPI measure of rent inflation both before and after the pandemic.
Conversion to rentals are probably providing some support, but as carrying costs increase via higher taxes, insurance and maintenance plus vacancies occur the aggravation will eventually cause most of these landlords to sell.
A 7% return is obliterated with one month of no rent, add in two months rent as cost of make ready and now your 7-15% yield, lacking 25% of income, is now a loss.
A homeowner can go 20 years without requiring major repairs, a landlord can go 7 years at most. The management company will make money regardless.
Not to mention that money aside, being a landlord is a huge pain in the butt. Anyone doing it for a 3-5% cap rate is insane, and there’s been a lot of that in the past few years.
It might be a good stop gap for some people, but this idea that people who need to sell won’t and will just rent it out forever, is a fantasy in my opinion.
Traditionally, according to long term buy and hold landlords with lots of properties I have discussed ”maintenance” with in past decades, one must figure 10% annually to keep properties from becoming run down/ slums.
Don’t know if that has changed materially in the last few decades due to better caulks and other similar materials, but, if anything, I would think it would go UP due to labor increases.
Any of the big ticket items (AC, roof, lawn replacement) can and will eliminate expected profits unless properly budgeted for. As of recently the extreme inflation in the costs has made this rental rate challenging to guesstimate. Having a pay to immediately replace an Air Conditioning unit at $20k in Southern California can be HELL
Owners to renters? That can happen until this inflationary environment leads to earnings compression which leads to job losses.
We had an amazing increase in the money supply over the last few years (actually since the crash in 1987) that created this amazingly high rate of inflation. That is now in the rear view mirror but a lot of that money is still sloshing around the system. Inflation is great at first as it affects assets and people feel the wealth effect. It also creates very unstable business conditions. If let go it will destroy a currency and society.
Powell is determined to stop it.
Stopping it means bringing demand down below the level of production. The only way known to do this is with reducing the money supply which means recession. The way to do this is to not only slow the creation of new money but for a time actually stop it. This will cause a recession.
Recession means job losses and eventually not only assets no longer going up in a parabolic way but actually reclining to a more usable, more equitable level. Where money has meaning and value. Where a people who do the jobs that keep society working can actually afford to live and eat and maybe even prosper.
Powell has no choices. There can be no return to exaggerated high prices as those just continue to exacerbate the problems in our system. If people can not afford to live where there is employment, the entire system collapses.
So get ready for lower house and stock prices. The exaggerated wealth created by inflation is going to come out one way or another. What Powell is doing is going to be harsh but way better than the alternative of societal collapse.
Jpjpjp,
The math of that article in only half of the equation. And it leads you to the wrong conclusion.
So, about 10% of home sellers are now trying to become landlords, good luck. This is a little higher than normal.
But in terms of keeping prices higher, no, that’s the wrong conclusion.
Converting a vacant house for sale to a rental and filling it with a tenant takes one household out of one housing unit and puts it into a another housing unit, and so there is a new vacant housing unit on the market — maybe rental, maybe owned… I know someone who sold a house at the peak of the market because she saw this coming, and then moved into a rental.
In other words, converting a for sale home to a rental and filling it opens up a new vacant home somewhere else. For the overall market, there is no change.
What drove up home prices in part were vacant homes that were not on the market, that people had moved out of to move into the new home they’d bought, and they’d hoped to rise up the price spike all the way with both homes and then sell it. And now they can’t sell it , so they’re trying to rent it out.
The key part is that now the home won’t be vacant anymore, which takes pressure off the housing market.
I love the delusion of riches by renting out your old home rather than selling it. A renter treats the place like trash, and the next actual buyer can see it from the moment they walk in the door. Result, lower offered prices or a big restoration bill to get the residence up to par. Some portion of what you thought you gained from the rents are lost at re-sale.
Unfortunately, I still get many unsolicited “offer on your property” calls per property I own in a ‘hot’ southeast housing market every day so there is still a lot of investor money out there trying to get into the housing market.
Note that while these calls are robodialed, live people handle them. At this point, the FCC’s attempts at reducing spam robocalls appear to have started working as I do seem to get a lot fewer ‘expired auto warranty’ and other sundry scam calls nowadays. Unfortunately, the reduction in volume of these calls has been more than made up for by these annoying “I want to make an offer on your property” calls.
As for the property market itself… there does seem to be a bit more inventory on the market and prices appear to have finally stopped rising. We’ll have to see if the west coast price cuts make it over here to the East. So far these have been relatively rare but as we enter the fall season hopefully there will be more of them coming.
So it would seem we’ve still got a long, long way to go, I know
About 18 years, so whatever you planned to do with your life, sooner would be better than later. There’s no time but the present because most of the future has been used up to pay for the past.
It appears that housing in these bubble areas if not nationally has outperformed most other assets (stocks, bonds, precious metals etc.) but not all (e.g. some crypto) during the pandemic era.
I’ve started hanging up on any call I receive where there is a delay on the other end after you pick up. It’s usually a machine calling to see if you pick up. Can anybody confirm this?
With an answering machine you can just let your robot talk to their robot, not that they have anything to discuss.
In the future most phone conversations will be automated as actual people become obsolete but it’s definitely a thing already.
@Swamp Creature. Make the number a new contact “Do Not Answer”. Cellphones are so convenient except now I cant answer calls from unknown numbers.
If they don’t finish building more houses and condos, they might to finish build more apartments. The rental vacancy rate in 2009 was above 10%, now it is 6.1%. See chart at: Rental Vacancy Rate for the United States (USRVAC) Federal Reserve Economic Data.
Rental rates have continued to rise.
Vacancies are difficult to judge and it doesn’t take much of a collapse in one thing to turn rentals into a glut because housing stock often does flow from short term to long term and from owner to tenant depending on price. Anecdotally a company bought an apartment complex near me and jacked up the rental rates and predictably they went from having waiting lists to roughly 10% empty units.
Oh my.
The bursting of Housing Bubble I threatened to detonate the Financial Industrial Complex, requiring Trillions in bailouts, but Housing Bubble II looks at least twice as overinflated as HBI, so this should be interesting, and not in a good way.
Meanwhile, more people are going out into the desert. This is despite projections that Las Vegas and Phoenix will become uninhabitable before mortgages are paid off due to catastrophic climate change (strongly supported by policies enacted by the USSC), which is likely to have a strongly moderating effect on prices in said uninhabitable wastelands.
Meanwhile, average US farmland prices have soared past 5k/acre, costs to be recovered in soaring prices of milk and honey, led by CA and NJ at 15k/acre but not TX at 2400/acre, as what it lacks in quality it makes up in volume.
Europe is burning, but that’s becoming normal most places, except where it’s flooding.
Miami real estate ventures are exercises in wishful thinking.
Projections that civilization will collapse by 2040 are making 30-year bonds and mortgages look increasingly overoptimistic.
regarding the Southwest…
the restrictions on how much water can be used by each State, from the Colorado River, is important.
Some have reservoirs ….but it doesnt take much imagination to foresee a day when filling your swimming pool or watering your golf course in AZ might be restricted as well.
As for FL SC GA…… no hurricanes since the spike in real estate. When one hits, and it is a matter of time, the absentee owners and the newly relocated might be in for a shock.
I can offer a snap shot from the south.
Escrow closing soon (one of my offspringers not me) on nice 1995 brick 3/2 in better area of resortish city in the south Ozarks.
Was listed = to price of other homes in 30mi radius, needs some fixing/cleaning but definitely not a full remodel, its fully livable as is, new floors, appliances etc. They viewed many homes in the months before finding this gem, better than all the rest by leaps and bounds. The owner accepted offer full 30K under origional list price, still 30K over 2016 average closing but the others for sale in the area aint gonna like the new (under 200K) comp…
My anecdotal observations in San Diego tend to say the same thing the stats are reporting. I’m curious, however, how the city of San Diego compares to the county. I’m guessing still down, but by not as much. Certain zips within the city are still cooking (not on high heat, though, but still cooking).
I’m gonna get torched.
The data above confirms what we’re seeing on the ground here in the Swamp and neighboring suburbs. The really desirable neighborhoods are holding up well with small price increases. However, the the farther out you go from the city the worse things get. Reminds me of the late 70s when the same thing happened and we had rising interest rates and a gas price crunch and the Carter “malaise” . Rents are holding up well and rising at double digit levels. People still need aplace to live.
What I’ve noticed in the Seattle-Tacoma metro area is that signs on houses are staying up much longer. I’ve also noticed that the pending sales signs are vanishing. In my specific neighborhood I have one house a block away that was “pending” and now is not, a neighbor who’s lived by flipping who’s gone into economy mode, and another who, having already bought another place, has decided to “wait” before he puts his current place up for sale.
Even “for rent” signs seem to be staying up longer.
It will be interesting to see the assessments this year, and if property taxes will decline also.
I noticed the same in Bellevue around where I live. I did see several “Pending” signs staying for 2-3 weeks then disappeared – but I didn’t find these homes on the Zillow (in “recently sold”).
I can offer an insight for UK readers.
The house I put up for sale in April this year has just completed. Upon visiting the estate agents and having a chat, their summary was that price increases have stopped. They also said that a large number of Sales are falling through ( he didn’t give numbers but showed a big pile of sales paperwork where the buyer had pulled out of the sale) , overall interest is down and he thinks that price falls will be coming very soon. This is on the east coast of the UK.
I just can’t get excited about 0.1%, although I’m not looking in these metros. Yes, sentiment changes, but the high rents in non-metros have made it different this time. If you can rent a place out for more than the mortgage, you are not absolutely forced to sell, which slows down any decline. Investors are still sitting out in the West where I look, but rents doubled in desirable towns in the last few years, with little new construction. People are paying these rents and increased numbers of second homes and nightly rentals destroy local renters. The increased foreclosure filings are either cured or kicked down the road another year or two by bankruptcy filings.
Great data and am in Capital Markets so I love this stuff!
I live in the foothills west of Denver. I can tell you homes are not moving. A neighbor has had his home up for sale since March. Nary a nibble.
Well your neighbor needs to price it right…more like Dec 2019 level and it will hopefully sell.
A stagnation of sorts seems to be settling in for most of the US right now, with maybe a few exceptions.
High end housing probably fluctuates a lot more than median or lower cost housing since it has a lot more “room” to move up and down.
No expert, just a casual observer with a little interest in how the real estate markets are going in general.
Tech layoffs…that price insensitive tech worker in SF and LA who *needed* the place near the office has dissapeared now that its work from anywhere, or relo to some cheaper metro. That reality is sinking in…and prices/volume are correcting as a result.
I guess if you want to see “real”-time information you have to look at mortgage applications. less applications = less sale
I remember reading few days ago the mortgage applications are down @ 50%, that is huge and will translate in less sale and more inventory
In 1 year we will have the full picture, obviously too late and deep in the woods… just like ’08
Your email address will not be published.
Historic-low layoffs, astronomical job openings, aggressive hiring, massive churn & job hopping: Weirdest labor market ever.
Credit-score inflation throws a monkey wrench into the calculus of credit risk.
The BoC’s QT started much earlier and is way ahead of the Fed’s QT.
Powell quotes Volcker, promises to “use our tools forcefully,” take “forceful and rapid steps” to reduce demand until “confident the job is done,” though it’ll bring “pain to households and businesses,” but not doing it will cause “far greater pain.” Hawk city. Finally got through to the markets?
Spending on gasoline plunges due to plunge in price. “Real” spending on durable goods, amazingly, jumps for 2nd month. Services spending rises but stuck below pre-pandemic trend.
Copyright © 2011 – 2022 Wolf Street Corp. All Rights Reserved. See our Privacy Policy
Powerful Wealth Building Resources

