
The Inflation Factor: How Rising Food and Energy Prices Impact the Economy
Ranked: The Most Popular Fast Food Brands in America
Ranked: America’s Best States to Do Business In
Visualizing Major Layoffs At U.S. Corporations
3 Reasons for the Fertilizer and Food Shortage
Visualized: The State of Central Bank Digital Currencies
The Evolution of Media: Visualizing a Data-Driven Future
33 Problems With Media in One Chart
The Top Downloaded Apps in 2022
Synthetic Biology: The $3.6 Trillion Science Changing Life as We Know It
Charting the Relationship Between Wealth and Happiness, by Country
Mapped: A Snapshot of Wealth in Africa
Mapped: The Wealthiest Billionaire in Each U.S. State in 2022
Visualized: The State of Central Bank Digital Currencies
Mapped: The Salary You Need to Buy a Home in 50 U.S. Cities
Visualizing the Relationship Between Cancer and Lifespan
Explainer: What to Know About Monkeypox
Visualizing How COVID-19 Antiviral Pills and Vaccines Work at the Cellular Level
Mapped: The Most Common Illicit Drugs in the World
Visualizing The Most Widespread Blood Types in Every Country
All Electric Semi Truck Models in One Graphic
The Inflation Factor: How Rising Food and Energy Prices Impact the Economy
Visualizing China’s Dominance in the Solar Panel Supply Chain
Visualizing 10 Years of Global EV Sales by Country
Which Countries Produce the Most Natural Gas?
Ranked: The 20 Countries With the Fastest Declining Populations
Iconic Infographic Map Compares the World’s Mountains and Rivers
Mapped: A Decade of Population Growth and Decline in U.S. Counties
Mapped: The State of Global Democracy in 2022
Mapped: Solar and Wind Power by Country
Mapped: The 10 Largest Gold Mines in the World, by Production
The 50 Minerals Critical to U.S. Security
Visualizing China’s Dominance in Clean Energy Metals
The Periodic Table of Commodity Returns (2012-2021)
Visualizing the Abundance of Elements in the Earth’s Crust
Visualizing China’s Dominance in the Solar Panel Supply Chain
All the Contents of the Universe, in One Graphic
Explained: The Relationship Between Climate Change and Wildfires
Visualizing 10 Years of Global EV Sales by Country
Timeline: The Domestication of Animals
Published
on
By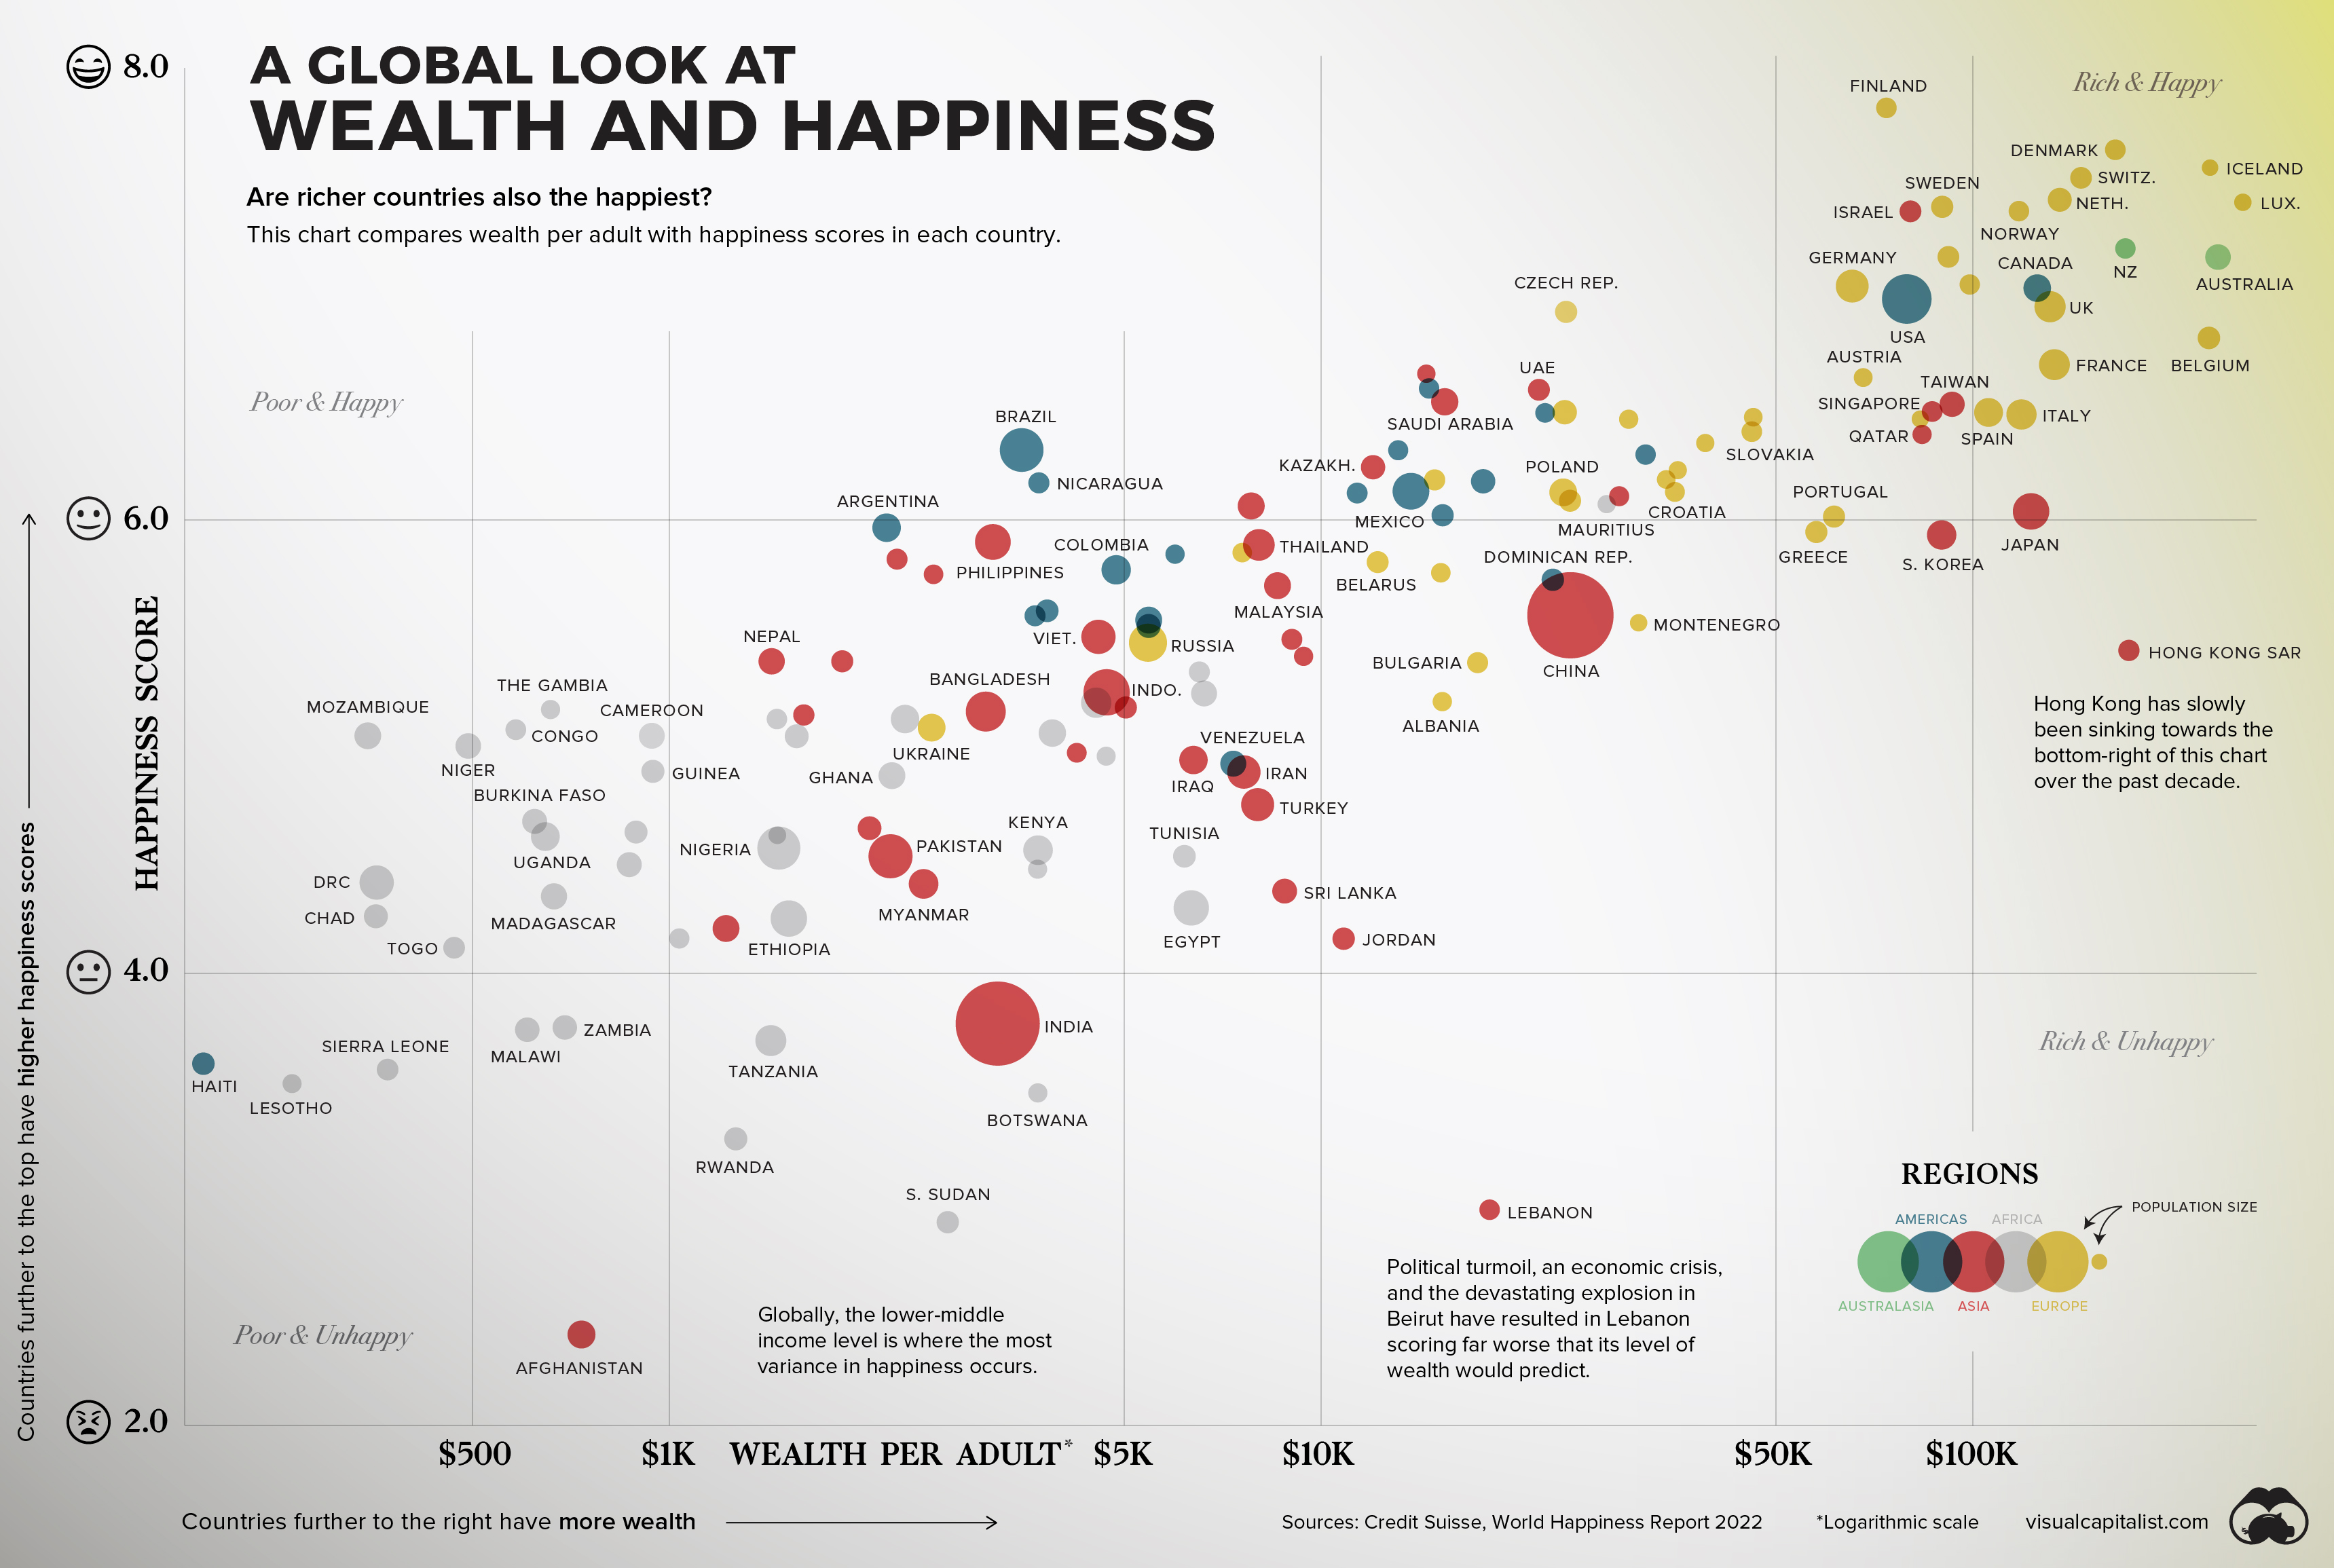


Throughout history, the pursuit of happiness has been a preoccupation of humankind.
Of course, we humans are not just content with measuring our own happiness, but also our happiness in relation to the people around us—and even other people around the world. The annual World Happiness Report, which uses global survey data to report how people evaluate their own lives in more than 150 countries, helps us do just that.
The factors that contribute to happiness are as subjective and specific as the billions of humans they influence, but there are a few that have continued to resonate over time. Family. Love. Purpose. Wealth. The first three examples are tough to measure, but the latter can be analyzed in a data-driven way.
Does money really buy happiness? Let’s find out.
To crunch the numbers, we looked at data from Credit Suisse, which breaks down the average wealth per adult in various countries around the world.
The table below looks at 146 countries by their happiness score and wealth per adult:
While the results don’t definitively point to wealth contributing to happiness, there is a strong correlation across the board. Broadly speaking, the world’s poorest countries have the lowest happiness scores, and the richest report being the most happy.
While many of the countries follow an obvious trend (more wealth = more happiness), there are nuances and outliers worth exploring.
We’ve looked at the relationship between wealth and happiness between countries, but what about within countries?
The Gini Coefficient is a tool that allows us to do just that. This measure looks at income distribution across a population, and applies a score to that population. Simply put, a score of 0 would be “perfect equality”, and 1 would be “perfect inequality” (i.e. an individual or group of recipients is receiving the entire income distribution).
Combined with the same happiness scale as before, this is how countries shape up.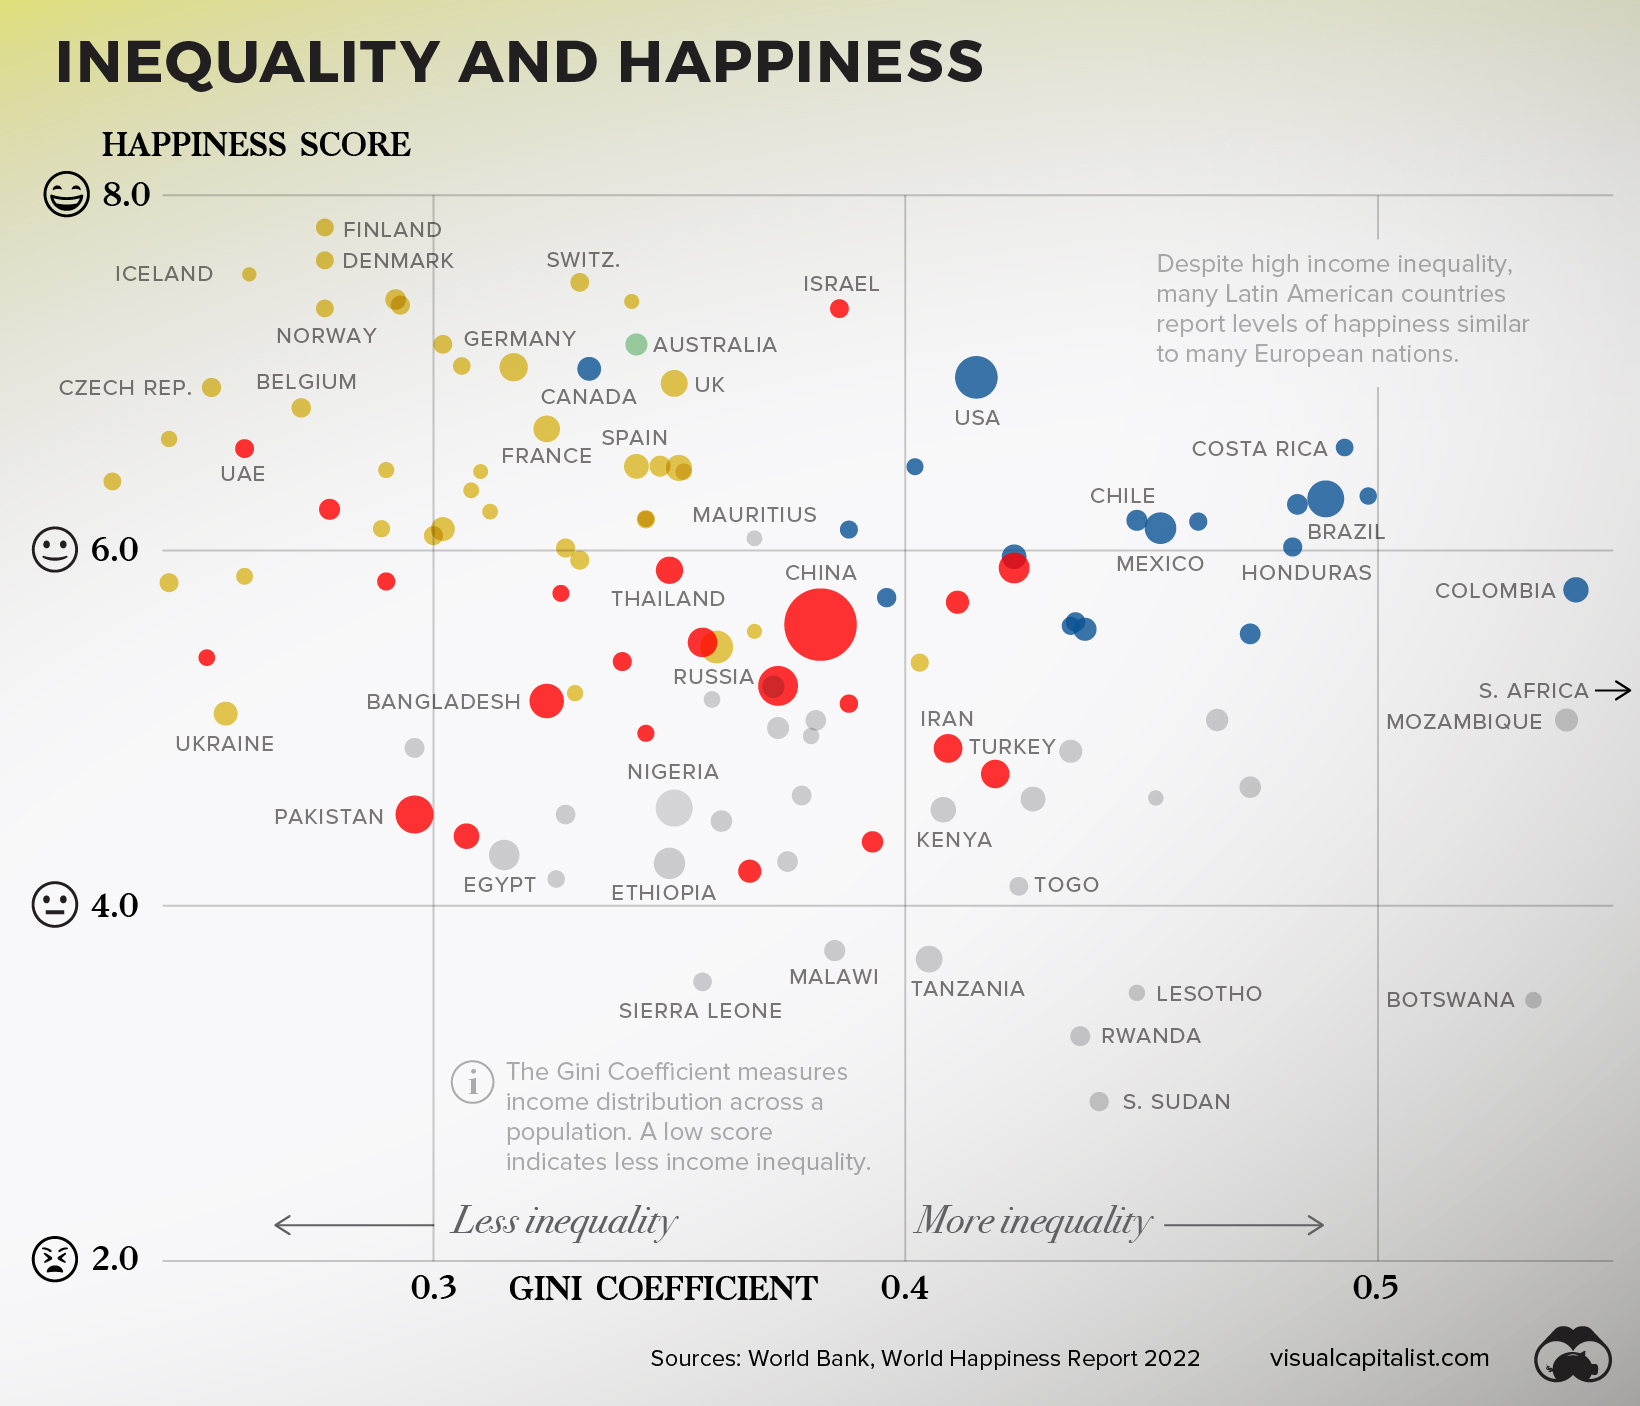
While there is no ironclad conclusion that can be derived from this dataset, there are big picture observations worth highlighting.
The 15 Countries With Highest Income Inequality
| Countries with High inequality | Happiness Score | Gini Score |
|---|---|---|
| 🇿🇦 South Africa | 5.2 | 0.63 |
| 🇳🇦 Namibia | 4.5 | 0.59 |
| 🇿🇲 Zambia | 3.8 | 0.57 |
| 🇨🇴 Colombia | 5.8 | 0.54 |
| 🇲🇿 Mozambique | 5.0 | 0.54 |
| 🇧🇼 Botswana | 3.5 | 0.53 |
| 🇿🇼 Zimbabwe | 3.0 | 0.50 |
| 🇵🇦 Panama | 6.3 | 0.50 |
| 🇨🇷 Costa Rica | 6.6 | 0.49 |
| 🇧🇷 Brazil | 6.3 | 0.49 |
| 🇬🇹 Guatemala | 6.3 | 0.48 |
| 🇭🇳 Honduras | 6.0 | 0.48 |
| 🇧🇫 Burkina Faso | 4.7 | 0.47 |
| 🇪🇨 Ecuador | 5.5 | 0.47 |
| 🇨🇲 Cameroon | 5.0 | 0.47 |
| Average | 5.2 | 52 |
First, countries with lower income inequality tend to also report more happiness. The 15 countries in this dataset with the highest inequality (shown above) have an average happiness score 1.3 lower than the 15 countries with the lowest inequality (shown below).
The 15 Countries With Lowest Income Inequality
| Countries with low inequality | Happy Score | Gini Score |
|---|---|---|
| 🇸🇰 Slovakia | 6.4 | 23.2 |
| 🇧🇾 Belarus | 5.8 | 24.4 |
| 🇸🇮 Slovenia | 6.6 | 24.4 |
| 🇦🇲 Armenia | 5.4 | 25.2 |
| 🇨🇿 Czech Republic | 6.9 | 25.3 |
| 🇺🇦 Ukraine | 5.1 | 25.6 |
| 🇲🇩 Moldova | 5.9 | 26 |
| 🇦🇪 United Arab Emirates | 6.6 | 26 |
| 🇮🇸 Iceland | 7.6 | 26.1 |
| 🇧🇪 Belgium | 6.8 | 27.2 |
| 🇩🇰 Denmark | 7.6 | 27.7 |
| 🇫🇮 Finland | 7.8 | 27.7 |
| 🇳🇴 Norway | 7.4 | 27.7 |
| 🇰🇿 Kazakhstan | 6.2 | 27.8 |
| 🇭🇷 Croatia | 6.1 | 28.9 |
| Average | 6.5 | 26 |
Next, interesting regional differences emerge.
Despite high income inequality, many Latin American countries report levels of happiness similar to many much-wealthier European nations.
People have been seeking understanding on happiness for millennia now, and it’s unlikely that slicing and dicing datasets will crack the code. Still though, much like the pursuit of happiness, the pursuit of understanding is human nature.
And, in more concrete terms, the more policymakers and the public understand the link between wealth and happiness, the more likely we can shape societies that give us a better chance at living a happy life.
Where does this data come from?
Source: Credit Suisse Global Wealth Databook 2021, World Happiness Report 2022, World Bank
Data notes: This visualization includes countries that had available data for both happiness and wealth per adult. Credit Suisse notes that due to incomplete data, the following countries are estimates of average wealth per adult: North Macedonia, Kosovo, Guatemala, Dominican Republic, Honduras, Uzbekistan, Côte d’Ivoire, and South Sudan. Happiness data for countries is from the 2022 report, with the exception of: Qatar, DRC, Haiti, and South Sudan, which pull from the 2019 report. For Gini Coefficient calculations, only countries with data from 2014 onward were included. As a result, major economies such as India and Japan are excluded from that visualization.
Chart note: The wealth axis was plotted logarithmically to better show the trend visually. This approach is often used when a small number of results skew the visualization, making it harder to glean insight from. In this case, there are large extremes between the richest and poorest countries around the world.
Mapped: A Snapshot of Wealth in Africa
Mapped: The Wealthiest Billionaire in Each U.S. State in 2022
Poll: Inflation is the Top Financial Concern for Americans
The Best Months for Stock Market Gains
Objects of Desire: Record Breaking Auction Sales in 2021
How Much Prime Real Estate Could You Buy for $1 Million?
The Richest People in the World in 2022
Total private wealth in Africa is now estimated to be US$2.1 trillion. This map looks at where all that wealth is concentrated around the continent.
Published
on
By
The continent of Africa contains more than 50 countries, but just five account for more than half of total wealth on the continent: South Africa, Egypt, Nigeria, Morocco, and Kenya.
Despite recent setbacks in Africa’s largest economies, wealth creation has been strong in a number of areas, and total private wealth is now estimated to be US$2.1 trillion. There also an estimated 21 billionaires in Africa today.
Drawing from the latest Africa Wealth Report, here’s a look at where all that wealth is concentrated around the continent.
South Africa is a still a major stronghold of wealth in Africa, with a robust luxury real estate market and ample wealth management services. The country is also ranked second on the continent in per capita wealth. That said, the country has faced challenges in recent years.
An estimated 4,500 high net worth individuals (wealth of US$1 million or more) have left South Africa over the past decade, migrating to places like the UK, Australia, and the United States. In one stark data point, the report points out that “there are 15 South African born billionaires in the world, but only 5 of them still live in South Africa.”
Here is how major African countries compare in terms of per capita wealth.
Mauritius is Africa’s wealthiest nation on a per capita basis. Here are a few reasons why the island nation comes out on top:
As a result, Mauritius has seen the strongest growth in total private wealth over the past decade, followed by Rwanda and Ethiopia.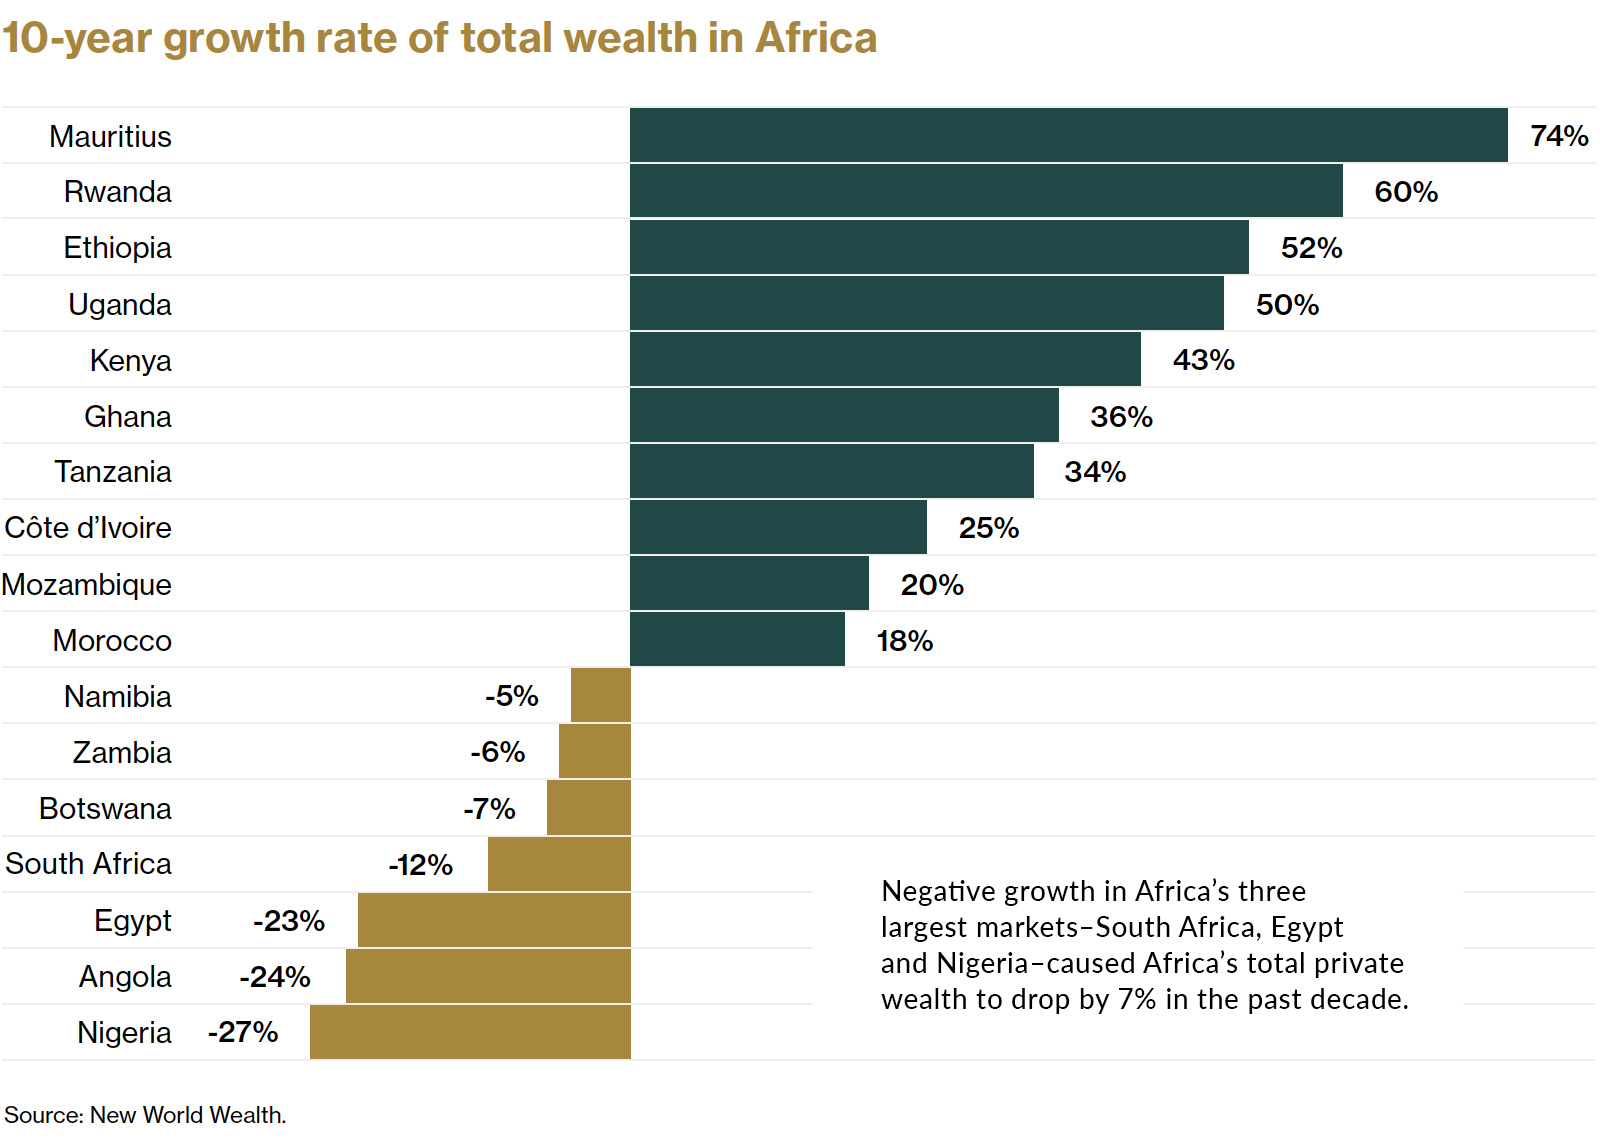
On the flip side of the equation, Nigeria—which is Africa’s largest economy—saw a steep drop in total wealth. The country has struggled in recent years with high unemployment, corruption, and an over-reliance on crude oil.
Over time, African countries are becoming less dependent on extractive industries, and business conditions are continuing to improve nearly across the board. These tailwinds, combined with the continent’s favorable demographics, point to a bright economic future for Africa.
The outlook for private wealth on the continent is largely positive as well. Total private wealth held in Africa is expected to reach US$3 trillion by 2031, an increase of close to 40%.
America is home to the most billionaires in the world. But which billionaire is the richest in each state?
Published
on
By
The U.S. is home to over a quarter of the world’s billionaires, representing about 720 of the roughly 2,700 that exist globally.
While the country has more billionaires than any other, the U.S. share of global billionaires has actually been shrinking in recent decades. In 2010, about 40% of the world’s billionaire population lived in America—and today, that number is closer to 27%.
But who is the richest billionaire in every American state in 2022? This graphic uses data from Forbes to find out.
The billionaires on this list have made their fortune in a wide range of industries, including tech, automobiles, asset management, and video games.
Jeff Bezos and Elon Musk have had their relative fortunes fluctuate in tandem with Amazon and Tesla stock prices in recent years. The volatility in share prices has meant they’ve each carried the title of the world’s wealthiest person at varying points.
Jeff Bezos previously had the top spot but now has a net worth of $162 billion. While he’s stepped down from the CEO role and has sold large amounts of Amazon stock, his ranking will likely still tie in closely to the company’s performance for the foreseeable future.
Elon Musk is the richest billionaire in Texas, however, he only recently became a resident of the state. His move is part of a broader migration trend occurring in the U.S. today, where California is experiencing a population decline for the first time ever. Last year, 68% of counties in California saw population declines, and data from the U.S. Census Bureau suggests many of these Americans opted for states like Florida and Texas.
Between 2019 to 2021, the South is the only region that saw positive net flows of over a million people, while the Northeast, Midwest, and West all saw declines.
Warren Buffett, the “Oracle of Omaha,” is the richest billionaire in Nebraska by a wide margin, with a net worth of $105 billion. Despite the stock market experiencing one of its worst starts to the year historically, Buffett’s net worth has been surprisingly steady.
This might be due to value assets rotating back into fashion in favor of growth and tech themes this year. Also, historically Buffett has been bullish in environments where fear and negative sentiment reflect through lower asset prices.
There are eight different women that hold the title of richest billionaire in their state.
Tamara Gustavson is Public Storage’s largest shareholder, with an 11% stake in the company, valued at $60 billion on the New York Stock Exchange. In addition, she acts as the director of the company and is the daughter of founder B. Wayne Hughes, who recently passed away last year. Incredibly, Public Storage operates more than 170 million square feet of real estate.
Abigail Johnson and Jacqueline Mars were featured on our infographic showing the richest women in the world last year. Johnson has served as CEO of top asset manager Fidelity, which her grandfather Edward Johnson founded. And Jacqueline Mars is part of the Mars family, which owns the world’s largest candy maker.
The U.S. wealth landscape is one of extremes. On one end, there are ample opportunities to earn substantial wealth, but on the other, wealth inequality and income disparity are higher than many other peer countries.
This productivity and hustle-oriented culture suggests that while there isn’t a billionaire in every state in 2022, it seems like it’s only a matter of time before the likes of Alabama, New Mexico, and North Dakota add a billionaire to their ranks.
Mapped: The Wealthiest Billionaire in Each U.S. State in 2022
Ranked: Top 10 Countries by Military Spending
Ranked: The Most and Least Livable Cities in 2022
Brand Loyalty is Declining for Most Luxury Automakers
Sharpen Your Thinking with These 10 Powerful Cognitive Razors
Ranked: The Top 25 Islands to Visit in 2022
Visualized: The Value of U.S. Imports of Goods by State
Ranked: The Most Popular Fast Food Brands in America
Copyright © 2022 Visual Capitalist


