
Visualizing Major Layoffs At U.S. Corporations
3 Reasons for the Fertilizer and Food Shortage
Countries with the Highest Default Risk in 2022
The $100 Trillion Global Economy in One Chart
News Explainer: The Economic Crisis in Sri Lanka
The Evolution of Media: Visualizing a Data-Driven Future
33 Problems With Media in One Chart
The Top Downloaded Apps in 2022
Synthetic Biology: The $3.6 Trillion Science Changing Life as We Know It
How Do Big Tech Giants Make Their Billions?
Mapped: The Salary You Need to Buy a Home in 50 U.S. Cities
Countries with the Highest Default Risk in 2022
What Does It Take To Be Wealthy in America?
Household Income Distribution in the U.S. Visualized as 100 Homes
Interest Rate Hikes vs. Inflation Rate, by Country
Visualizing the Relationship Between Cancer and Lifespan
Explainer: What to Know About Monkeypox
Visualizing How COVID-19 Antiviral Pills and Vaccines Work at the Cellular Level
Mapped: The Most Common Illicit Drugs in the World
Visualizing The Most Widespread Blood Types in Every Country
Visualizing 10 Years of Global EV Sales by Country
Which Countries Produce the Most Natural Gas?
Visualizing the World’s Largest Oil Producers
A Lifetime’s Consumption of Fossil Fuels, Visualized
Visualized: Battery Vs. Hydrogen Fuel Cell
Ranked: The 20 Countries With the Fastest Declining Populations
Iconic Infographic Map Compares the World’s Mountains and Rivers
Mapped: A Decade of Population Growth and Decline in U.S. Counties
Mapped: The State of Global Democracy in 2022
Mapped: Solar and Wind Power by Country
Mapped: The 10 Largest Gold Mines in the World, by Production
The 50 Minerals Critical to U.S. Security
Visualizing China’s Dominance in Clean Energy Metals
The Periodic Table of Commodity Returns (2012-2021)
Visualizing the Abundance of Elements in the Earth’s Crust
All the Contents of the Universe, in One Graphic
Explained: The Relationship Between Climate Change and Wildfires
Visualizing 10 Years of Global EV Sales by Country
Timeline: The Domestication of Animals
5 Things to Know About Europe’s Scorching Heatwave
Published
on
By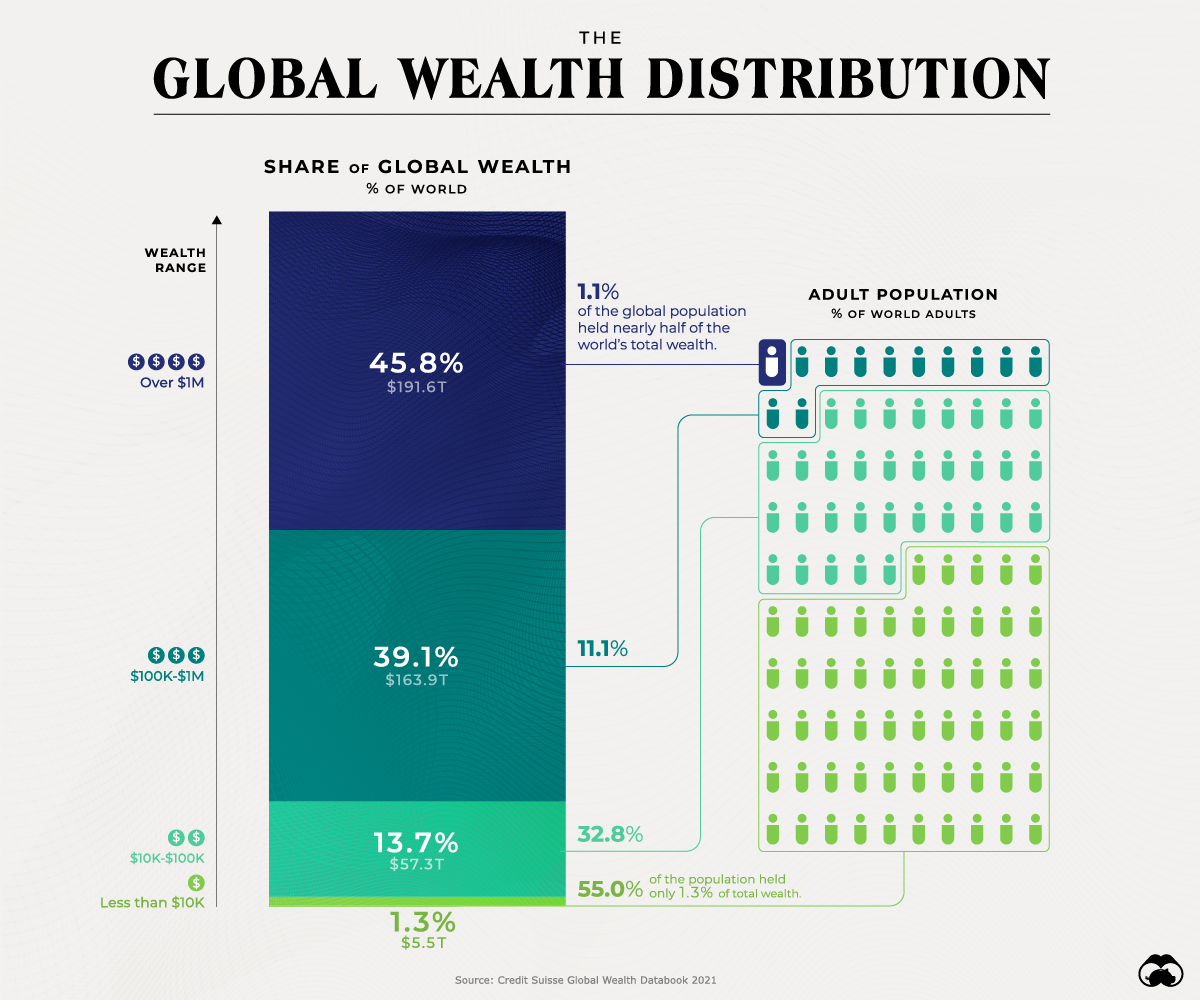


The pandemic resulted in global wealth taking a significant dip in the first part of 2020. By the end of March, global household wealth had already declined by around 4.4%.
Interestingly, after much monetary and fiscal stimulus from governments around the world, global household wealth was more than able to recover, finishing up the year at $418.3 trillion, a 7.4% gain from the previous year.
Using data from Credit Suisse, this graphic looks at how global wealth is distributed among the adult population.
While individuals worth more than $1 million constitute just 1.1% of the world’s population, they hold 45.8% of global wealth.
On the other end of the spectrum, 55% of the population owns only 1.3% of global wealth.
And between these two extreme wealth distribution cases, the rest of the world’s population has a combined 52.8% of the wealth.
While wealth inequality is especially evident within the wealth ranges mentioned above, these differences can also be seen on a more regional basis between countries.
In 2020, total wealth rose by $12.4 trillion in North America and $9.2 trillion in Europe. These two regions accounted for the bulk of the wealth gains, with China adding another $4.2 trillion and the Asia-Pacific region (excluding China and India) another $4.7 trillion.
Here is a breakdown of global wealth distribution by region:
India and Latin America both recorded losses in 2020.
Total wealth fell in India by $594 billion, or 4.4%. Meanwhile, Latin America appears to have been the worst-performing region, with total wealth dropping by 11.4% or $1.2 trillion.
Despite the burden of COVID-19 on the global economy, the world can expect robust GDP growth in the coming years, especially in 2021. The latest estimates by the International Monetary Fund in April 2021 suggest that global GDP in 2021 will total $100.1 trillion in nominal terms, up by 4.1% compared to last year.
The link in normal times between GDP growth and household wealth growth, combined with the expected rapid return of economic activity to its pre-pandemic levels, suggests that global wealth could grow again at a fast pace. According to Credit Suisse estimates, global wealth may rise by 39% over the next five years.
Low and middle-income countries will also play an essential role in the coming year. They are responsible for 42% of the growth, even though they account for just 33% of current wealth.
Ranked: Big Tech CEO Insider Trading During the First Half of 2021
Mapping The Biggest Companies By Market Cap in 60 Countries
Ranked: Top 10 Countries by Military Spending
Visualizing 10 Years of Global EV Sales by Country
Visualizing the World’s Largest Oil Producers
Visualized: The Top 25 U.S. Newspapers by Daily Circulation
How Much Land does the U.S. Military Control in Each State?
The $100 Trillion Global Economy in One Chart
Cyberattacks are becoming more frequent and sophisticated. Here’s what investors need to know about the future of cybersecurity.
Published
on
By
In 2020, the global cost of cybercrime was estimated to be around $945 billion, according to McAfee.
It’s likely even higher today, as multiple sources have recorded an increase in the frequency and sophistication of cyberattacks during the pandemic.
In this infographic from Global X ETFs, we highlight three major trends that are shaping the future of the cybersecurity industry that investors need to know.
Research from IBM determined that the average data breach cost businesses $4.2 million in 2021, up from $3.6 million in 2017. The following table breaks this figure into four components:
The greatest cost of a data breach is lost business, which results from system downtimes, reputational losses, and lost customers. Second is detection and escalation, including investigative activities, audit services, and communications to stakeholders.
Post breach response includes costs such as legal expenditures, issuing new accounts or credit cards (in the case of financial institutions), and other monitoring services. Lastly, notification refers to the cost of notifying regulators, stakeholders, and other third parties.
To stay ahead of these rising costs, businesses are placing more emphasis on cybersecurity. For example, Microsoft announced in September 2021 that it would quadruple its cybersecurity investments to $20 billion over the next five years.
According to IBM, companies that rely more on remote work experience greater losses from data breaches. For companies where 81 to 100% of employees were remote, the average cost of a data breach was $5.5 million (2021). This dropped to $3.7 million for companies that had under 10% of employees working from home.
A major reason for this gap is that work-from-home setups are typically less secure. Phishing attacks surged in 2021, taking advantage of the fact that many employees access corporate systems through their personal devices.
As detected by Trend Micro’s Cloud App Security.
Spam phishing refers to “fake” emails that trick users by impersonating company management. They can include malicious links that download ransomware onto the users device. Credential phishing is similar in concept, though the goal is to steal a person’s account credentials.
A tactic you may have seen before is the Amazon scam, where senders impersonate Amazon and convince users to update their payment methods. This strategy could also be used to gain access to a company’s internal systems.
AI-based cybersecurity can detect and respond to cyberattacks without any human intervention. When fully deployed, IBM measured a 20% reduction in the time it takes to identify and contain a breach. It also resulted in cost savings upwards of 60%.
A prominent user of AI-based cybersecurity is Google, which uses machine learning to detect phishing attacks within Gmail.
Machine learning helps Gmail block spam and phishing messages from showing up in your inbox with over 99.9% accuracy. This is huge, given that 50-70% of messages that Gmail receives are spam.
– Andy Wen, Google
As cybercrime escalates, Acumen Research and Consulting believes the market for AI-based security solutions will reach $134 billion by 2030, up from $15 billion in 2021.
The Global X Cybersecurity ETF (Ticker: BUG) seeks to provide investment results that correspond generally to the price and yield performance, before fees and expenses, of the Indxx Cybersecurity Index. See below for industry and country-level breakdowns, as of June 2022.
Totals may not equal 100% due to rounding.
Investors can use this passively managed solution to gain exposure to the rising adoption of cybersecurity technologies.
We explore the ultimate frontier: the composition of the entire known universe, some of which are still being investigated today.
As geopolitical tensions began to heat up around the world, which nations were the top military spenders in 2021?
More carbon in the atmosphere is creating a hotter world—and gradually fueling both climate change and instances of wildfires.
U.S. goods imports were worth $2.8T in 2021. From east coast to west, this visualization breaks down imports on a state-by-state basis
Here are 10 razors, or rules of thumb, that help simplify decision-making, inspired by a list curated by the investor and thought leader Sahil Bloom.
Brand loyalty has declined for most luxury automakers, but three brands—Tesla, Maserati, and Genesis—appear to have bucked the trend.
This infographic highlights the accelerating pace of layoffs so far in 2022, as businesses cut costs ahead of a potential recession.
Published
on
By
Hiring freezes and layoffs are becoming more common in 2022, as U.S. businesses look to slash costs ahead of a possible recession.
Understandably, this has a lot of people worried. In June 2022, Insight Global found that 78% of American workers fear they will lose their job in the next recession. Additionally, 56% said they aren’t financially prepared, and 54% said they would take a pay cut to avoid being laid off.
In this infographic, we’ve visualized major layoffs announced in 2022 by publicly-traded U.S. corporations.
Note: Due to gaps in reporting, as well as the very large number of U.S. corporations, this list may not be comprehensive.
Layoffs have surged considerably since April of this year. See the table below for high-profile instances of mass layoffs.
| Company | Industry | Layoffs (#) | Month |
|---|---|---|---|
| Peloton | Consumer Discretionary | 2,800 | February |
| Funko | Consumer Discretionary | 258 | April |
| Robinhood | Financial Services | ~400 | April |
| Nektar Therapeutics | Biotechnology | 500 | April |
| Carvana | Automotive | 2,500 | May |
| Doma | Financial Services | 310 | May |
| JP Morgan Chase & Co. | Financial Services | ~500 | June |
| Tesla | Automotive | 200 | June |
| Coinbase | Financial Services | 1,100 | June |
| Netflix | Technology | 300 | June |
| CVS Health | Pharmaceutical | 208 | June |
| StartTek | Technology | 472 | June |
| Ford | Automotive | 8,000 | July |
| Rivian | Automotive | 840 | July |
| Peloton | Consumer Discretionary | 2,000 | July |
| LoanDepot | Financial Services | 2,000 | July |
| Invitae | Biotechnology | 1,000 | July |
| Lyft | Technology | 60 | July |
| Meta | Technology | 350 | July |
| Technology | <30 | July | |
| Vimeo | Technology | 72 | July |
| Robinhood | Financial Services | ~795 | August |
Here’s a brief rundown of these layoffs, sorted by industry.
Ford has announced the biggest round of layoffs this year, totalling roughly 8,000 salaried employees. Many of these jobs are in Ford’s legacy combustion engine business. According to CEO Jim Farley, these cuts are necessary to fund the company’s transition to EVs.
We absolutely have too many people in some places, no doubt about it.
– Jim Farley, CEO, Ford
Speaking of EVs, Rivian laid off 840 employees in July, amounting to 6% of its total workforce. The EV startup pointed to inflation, rising interest rates, and increasing commodity prices as factors. The firm’s more established competitor, Tesla, cut 200 jobs from its autopilot division in the month prior.
Last but not least is online used car retailer, Carvana, which cut 2,500 jobs in May. The company experienced rapid growth during the pandemic, but has since fallen out of grace. Year-to-date, the company’s shares are down more than 80%.
Fearing an impending recession, Coinbase has shed 1,100 employees, or 18% of its total workforce. Interestingly, Coinbase does not have a physical headquarters, meaning the entire company operates remotely.
A recession could lead to another crypto winter, and could last for an extended period. In past crypto winters, trading revenue declined significantly.
Brian Armstrong, CEO, Coinbase
Around the same time, JPMorgan Chase & Co. announced it would fire hundreds of home-lending employees. While an exact number isn’t available, we’ve estimated this to be around 500 jobs, based on the original Bloomberg article. Wells Fargo, another major U.S. bank, has also cut 197 jobs from its home mortgage division.
The primary reason for these cuts is rising mortgage rates, which are negatively impacting the demand for homes.
Within tech, Meta and Twitter are two of the most high profile companies to begin making layoffs. In Meta’s case, 350 custodial staff have been let go due to reduced usage of the company’s offices.
Many more cuts are expected, however, as Facebook recently reported its first revenue decline in 10 years. CEO Mark Zuckerberg has made it clear he expects the company to do more with fewer resources, and managers have been encouraged to report “low performers” for “failing the company”.
Realistically, there are probably a bunch of people at the company who shouldn’t be here.
– Mark Zuckerberg, CEO, Meta
Also in July, Twitter laid off 30% of its talent acquisition team. An exact number was not available, but the team was estimated to have less than 100 employees. The company has also enacted a hiring freeze as it stumbles through a botched acquisition by Elon Musk.
Layoffs are expected to continue throughout the rest of this year, as metrics like consumer sentiment enter a decline. Rising interest rates, which make it more expensive for businesses to borrow money, are also having a negative impact on growth.
In fact just a few days ago, trading platform Robinhood announced it was letting go 23% of its staff. After accounting for its previous layoffs in April (9% of the workforce), it’s fair to estimate that this latest round will impact nearly 800 people.
Visualizing Which Countries Drink the Most Beer
Ranked: The 20 Countries With the Fastest Declining Populations
Mapped: The Salary You Need to Buy a Home in 50 U.S. Cities
Visualizing the World’s Largest Oil Producers
Which Countries Produce the Most Natural Gas?
Timeline: The Domestication of Animals
Ranked: The World’s Largest Container Shipping Companies
Brand Loyalty is Declining for Most Luxury Automakers
Copyright © 2022 Visual Capitalist

