

imaginima/E+ via Getty Images
imaginima/E+ via Getty Images
Broadstone Net Lease (NYSE:BNL) is a highly diversified net lease real estate investment trust (“REIT”) that has been investing in the space for about 15 years but only went public on the NYSE in 2020.
Year to date, BNL has sold off more than the Vanguard Real Estate ETF (VNQ) as well as the NETLease Corporate Real Estate ETF (NETL), with a nearly 20% decline for the net lease newcomer.

This despite BNL’s portfolio emphasis on above-average rent escalations and strong rent collection statistics during the pandemic.
In my judgement, the market has discounted BNL more than the average REIT because of its low exposure to investment grade tenants of about 15% of contractual rent. Like fellow highly diversified net lease REIT, W. P. Carey Inc. (WPC), BNL hedges the risk of lower credit tenants via high diversification as well as landlord-friendly lease terms like above-average rent escalations, tenant financial reporting, and master leases (cross-default provisions covering multiple properties leased to the same tenant).
Based on a midpoint of 2022 AFFO per share guidance of $1.40, BNL currently trades at a price-to-AFFO multiple of 14.3x at a share price of around $20. That is a bit lower than WPC’s current AFFO multiple of 14.8x, but in my humble opinion, WPC more than makes up for this slight premium through greater exposure to investment grade tenants, a slightly larger share of industrial properties in the portfolio, and a much greater share of CPI-linked rent escalations.
As such, though BNL makes a solid holding, I would rather allocate investment dollars to WPC right now.
Though I would not say that BNL has a significant competitive advantage against peers like WPC’s commanding position as a sale-leaseback provider, Agree Realty Corporation’s (ADC) cost of capital and asset quality, or Realty Income’s (O) size and scale, I would point out that BNL does have some positive points in its favor.
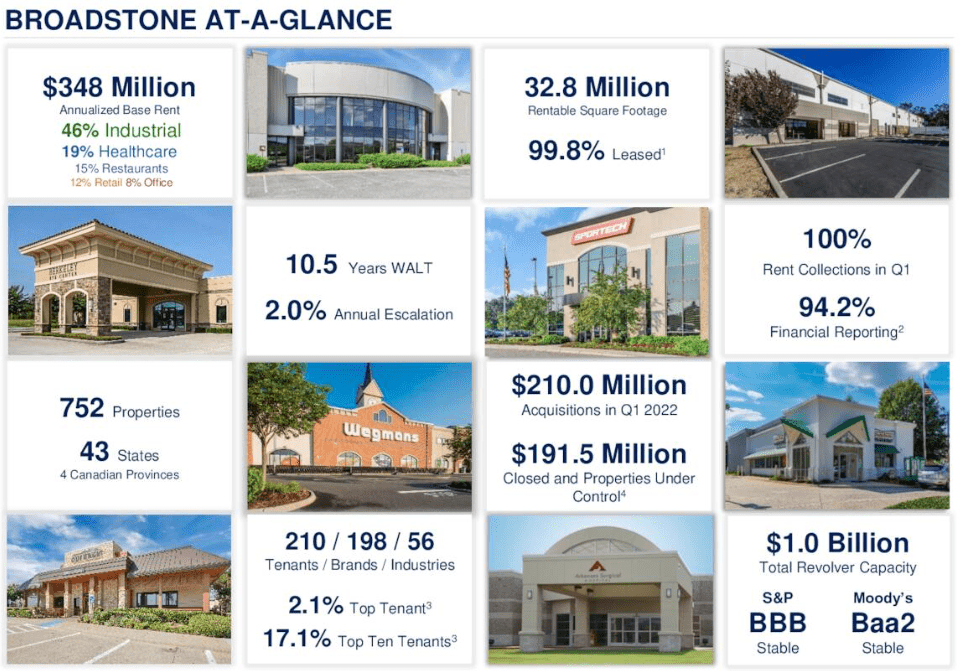
First, BNL has very few vacancies across its 750+ property portfolio. Second, the vast majority (94.2%) of BNL’s properties enjoy some form of tenant financial reporting, whether at the corporate level only or also at the unit (i.e. store or property) level.
BNL Q1 2022 Presentation
BNL Q1 2022 Presentation
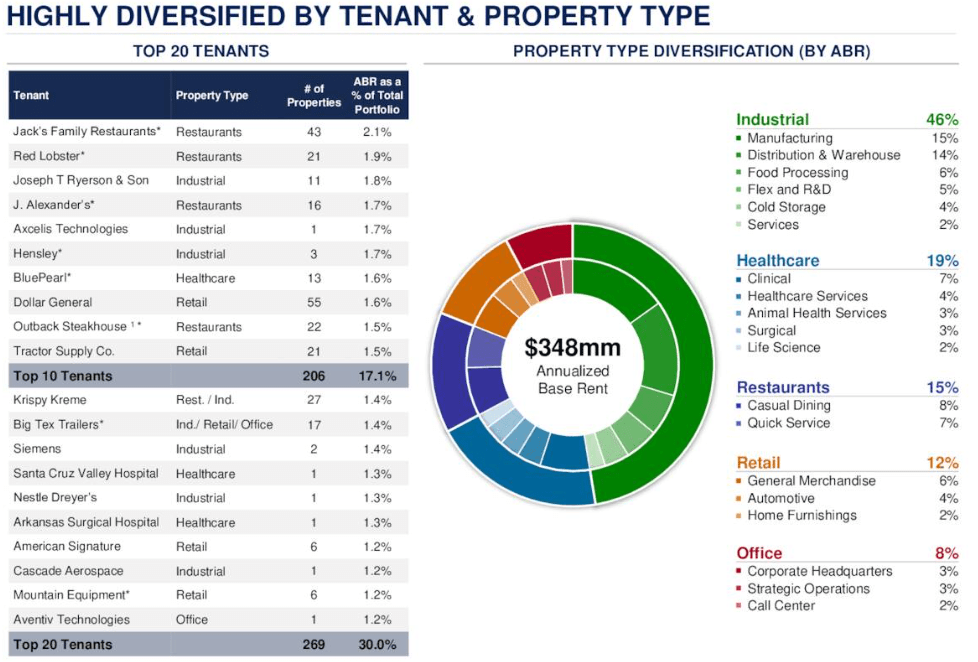
Third, BNL’s portfolio is highly diversified, far more than the average net lease REIT. This is exemplified by the fact that BNL’s top ten tenants make up only 17.1% of total rent.
This is both a strength and a weakness. It is a weakness because the market never seems to know how to price diversified REITs, and thus these stocks usually trade at a discount to their sum-of-the-parts valuation. But diversification is a strength, and probably a necessary one, for a REIT like BNL that focuses on non-investment grade credit tenants.
Likewise, diversification also provides the benefit of being able to pursue attractive acquisition opportunities across a number of industries and property types, depending on which one is most attractive and opportunistic at the time.
BNL Q1 2022 Presentation
BNL Q1 2022 Presentation
This factor makes BNL somewhat similar to STORE Capital (STOR) and Essential Properties Realty Trust (EPRT), which also focus on non-IG tenants, but BNL cannot boast as these two do that the majority of its properties were acquired as sale-leasebacks using its in-house lease form that includes all or almost all of its preferred lease terms.
Fourth, partially as a result of this focus on non-IG tenants, BNL enjoys above-average contractual rent escalations, averaging 2.0% across the portfolio.
BNL Q1 2022 Presentation
BNL Q1 2022 Presentation
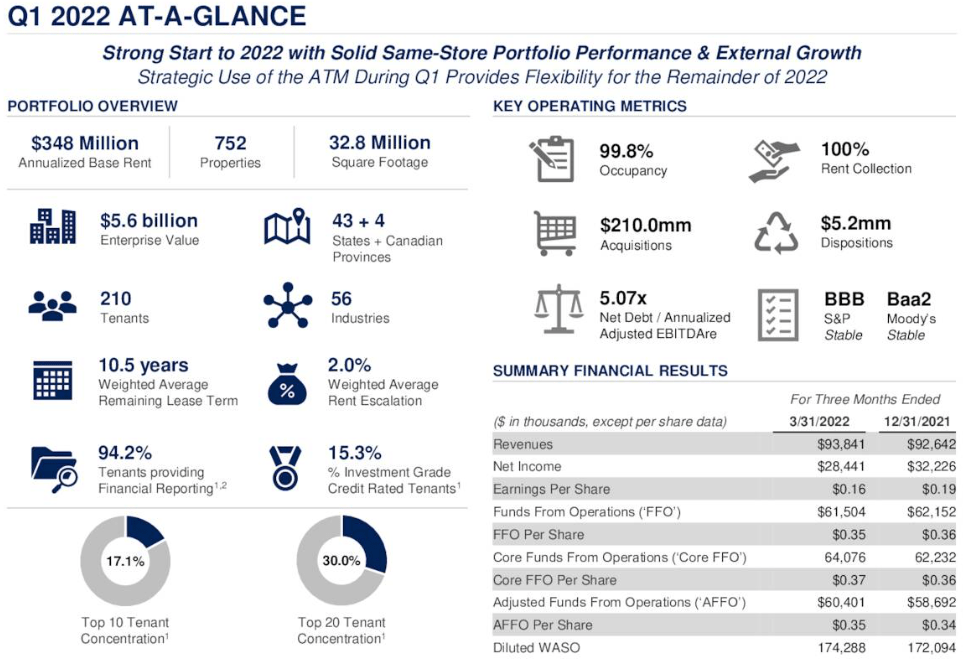
In the first quarter, BNL invested $210 million in 27 properties at a weighted average initial cap rate of 5.7%. This average entry cap rate is significantly below BNL’s typical acquisition cap rate range of 6.3% to 7.2% going back to 2015. But here’s an additional comment from CEO Chris Czarnecki from the Q1 earnings conference call:
The leases include a strong weighted average lease term of 19.3 years, and solid 1.5% annual rent escalations, translating into a GAAP cap rate of 6.4%.
Term has value in the world of net lease, or at least it has in a recent history characterized by low inflation and low interest rates. The 19+ years of remaining term on Q1 acquisitions goes a long way in explaining why the initial cap rate was so low.
As we find below, restaurants accounted for roughly half of Q1 acquisitions, while retail made up a little more than 1/3rd and industrial accounted for 13%.

BNL Q1 2022 Presentation
BNL Q1 2022 Presentation
My initial thought was that these newly acquired restaurants must have been quick service restaurants (“QSRs”), or fast food, because QSRs tend to trade at lower cap rates than casual dining properties. That would have explained the low weighted average acquisition cap rate of 5.7% for the quarter.
But that is not the case. Instead, these restaurants were apparently upscale restaurants (of unknown brands). Here’s Czarnecki again with commentary:
During the quarter we acquired a portfolio of 16 upscale restaurants located across 10 different states, for a total of $100 million. These will include weighted average annual rent escalations of 1.1% and a weighted average lease term of 19.5 years. The 16 sites were diversified across four different concepts and master lease to a national operator with nearly 50 total locations and over 30 years of experience. The assets are located in attractive retail corridors and exhibit strong operating metrics that translate into robust rent to sales and rent coverage ratios.
And then there are the retail properties acquired, which are mostly located in Canada, representing BNL’s first toe-dip into the Canadian real estate market. Here’s Czarnecki again:
These retail transactions include our first targeted portfolio acquisition in Canada, which is comprised of six high quality retail locations master leads to Canada’s leading retailer of outdoor recreation gear.
Last but not least are the two industrial properties acquired during the quarter. Czarnecki again:
Finally, we acquired two industrial assets and transactions for a total of $27 million during the first quarter. The leases include attractive weighted average annual rent escalations of 2.1% and a weighted average lease term of 18.5 years.
The large sum of restaurants acquired during the quarter caused BNL’s total restaurant exposure to tick up from 13% at the end of 2021 to 15% at the end of Q1.
But industrial, which has become the hottest property type since industrial rents began soaring during the pandemic, remains BNL’s largest segment at 46%. This is the second highest exposure to industrial properties in the net lease REIT space, behind WPC with a 50% allocation (unless you count STAG Industrial (STAG), which exclusively owns single-tenant net leased industrial properties).
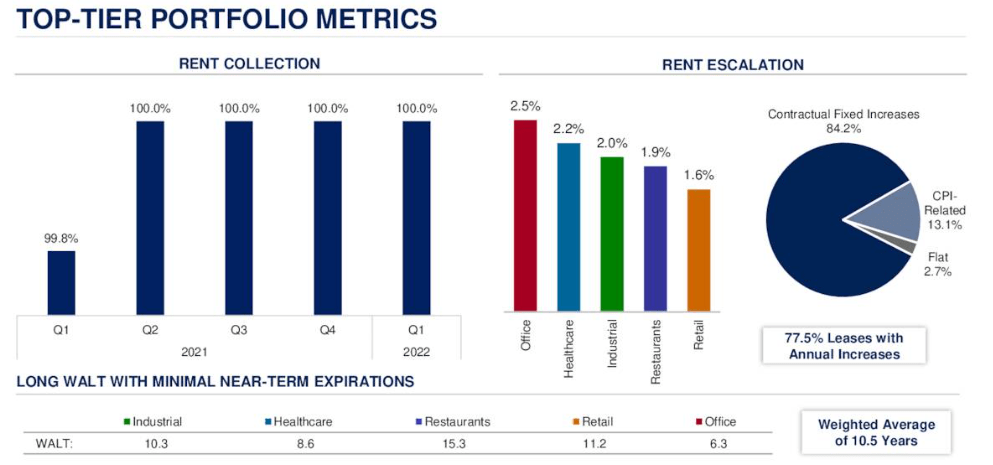
Surely this high exposure to industrial has played a large part in BNL’s impressive rent collection statistics in 2021, showing 100% from the second quarter onward.
BNL Q1 2022 Presentation
BNL Q1 2022 Presentation
Notice also from the above image that nearly all of BNL’s leases contain built-in rent escalations, with 13% also linked to the CPI. This positions BNL for inflation slightly better than the average net lease REIT, although it is not as well-positioned as WPC with 58% of its contractual rents linked to the CPI.
What about rising interest rates? At the current moment, debt markets look increasingly hostile to net lease REIT borrowing, as bond yields have surged higher year-to-date while there is no sign yet that cap rates are beginning to follow them higher.
Fortunately, BNL has vanishingly little debt maturing this year or next year and relatively little maturing before 2026.
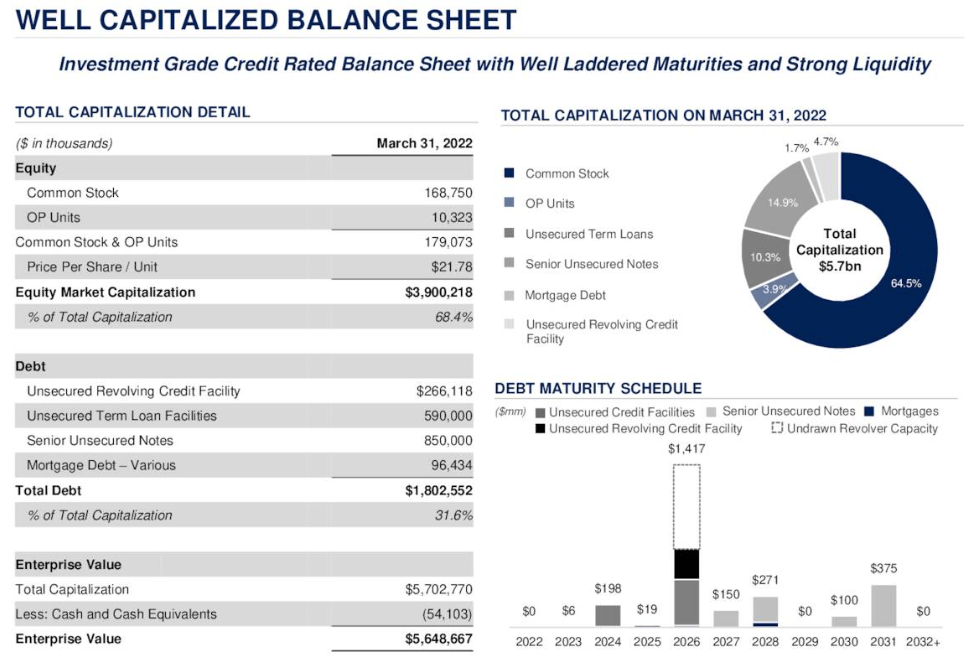
BNL Q1 2022 Presentation
BNL Q1 2022 Presentation
BNL enjoys an investment grade-rated balance sheet (BBB/Baa2), and a modest net debt to EBITDA ratio of 5.1x. This is lower than WPC’s 5.5x net leverage ratio, though WPC edges out BNL when it comes to its weighted average interest rate: 2.5%, compared to BNL’s 2.7%. Admittedly, both are extremely low.
BNL has $788 million of total liquidity between $54 million in cash and $734 million in availability on its credit facility, which should go a long way in funding the next few quarters’ acquisitions.
Finally, the quarterly dividend of $0.27 represents a payout ratio of 77% based on Q1 AFFO per share of $0.35. The annualized dividend also represents 77% of 2022 AFFO per share guidance.
When I peruse BNL’s portfolio and balance sheet, I don’t find much to complain about. I don’t care for the office exposure, but it’s only 8%, and WPC has a much larger allocation to that property type. And I also don’t particularly care for casual/fine dining properties, as these often lack corporate guarantees for their franchise operators, they are less recession-resistant than QSRs, and labor shortages have made it difficult for operators to remain fully staffed.
Moreover, I worry that BNL might be over-diversified – a jack of all trades but master of none. Surely management are not experts equally in the fields of automotive retailers, animal health facilities, call centers, and cold storage facilities. This causes me some degree of uncertainty about how BNL would fare during a non-pandemic recession.
That said, BNL’s strong pandemic-era rent collection statistics speak for themselves, showing that at least during that kind of downturn, the portfolio held up well.
Even so, due to higher emphasis on industrial and essential retail in current acquisitions, I favor WPC over BNL at present pricing. Though WPC’s payout ratio is slightly higher, so also is its dividend yield of 5.43%, compared to BNL’s 5.39%.
Moreover, WPC has a significantly higher share of CPI-linked rent escalations than BNL, which I believe will prove a very valuable difference between the two in the coming quarters (and perhaps years). WPC’s Q1 same-store rent growth came in at 2.7% and should remain above 2% for some time to come.
If you want access to our entire Portfolio and all our current Top Picks, feel free to join us for a 2-week free trial at High Yield Landlord.
We are the largest real estate investment community on Seeking Alpha with over 2,000 members on board and a perfect 5/5 rating from 400+ reviews:
For a Limited Time – You can join us at a deeply reduced rate!
Start Your 2-Week Free Trial Today!
This article was written by
My adult life can be broken out into three distinct phases. In my early 20s, I earned a bachelor’s degree in Cinema & Media Arts (emphasis in screenwriting), but I hated working in Hollywood. Too much schmoozing and far too much traffic. So, after leaving California, I earned a Master of Fine Arts in Creative Writing from Western State Colorado University. I loved writing fiction, but it didn’t pay the bills.
In my mid-20s, I became a real estate agent and gained some very valuable experience in residential and commercial real estate. But my passion for writing never went away.
Now, in my early 30s, I write for Jussi Askola’s excellent marketplace service, High Yield Landlord, as well as its sister service, High Yield Investor. I also perform freelance research for a family office that owns and manages over 40 net lease commercial properties in Texas and Arkansas. Writing about finance and investing scratches that creative itch while paying the bills – the best of both worlds.
I’m a Millennial with a long-term horizon and am fascinated with the magic of compound interest and dividend growth investing. I also have an interest in macroeconomic trends, though I am but an amateur in that field.
Disclosure: I/we have a beneficial long position in the shares of ADC, BNL, EPRT, O, STOR, WPC either through stock ownership, options, or other derivatives. I wrote this article myself, and it expresses my own opinions. I am not receiving compensation for it (other than from Seeking Alpha). I have no business relationship with any company whose stock is mentioned in this article.


