THE WOLF STREET REPORT
Imploded Stocks
Brick & Mortar
California Daydreamin’
Cars & Trucks
Commercial Property
Companies & Markets
Consumers
Credit Bubble
Energy
Europe’s Dilemmas
Federal Reserve
Housing Bubble 2
Inflation & Devaluation
Jobs
Trade
Transportation
It’s peak home-buying season in California, but sky-high home prices, holy-moly mortgage rates, the collapse of cryptos, the vanishing DeFi, and the implosion of tech startups, SPACs, and IPOs, all of which are crucial to the wealth, or perceived wealth, of many Californians, pulled the rug out from under California’s splendid housing markets.
Sales volume of single-family houses (SFH) in California plunged by 14% in July from June, seasonally adjusted, and by 31% from a year ago, the 13th month in a row of year-over-year declines, according to the California Association of Realtors.
Sales volume of condos plunged by 18% in July from June, and by 36% from a year ago.
Prices eventually follow volume: The median price of single-family houses dropped 3.5% in July from June, down for the second month in a row, slashing the year-over-year gain to just 2.8%. The median price of condos dropped 2.3%, down for the third month in a row, whittling down the year-over-year gain to 7.5%.
Sales volume of houses and condos in the entire San Francisco Bay Area has collapsed by 37% from a year ago.
Price has started to follow volume. Year-over-year, the median price of houses across the Bay Area was down for the first time since lockdown May 2020.
Year-over-year, it was down in three of the five big counties that cover San Francisco, Silicon Valley, and part of the East Bay, led by San Francisco, where the median price was down 8.2% year-over-year. We’ll get to the charts in a moment.
Sales volume of houses plunged by 20% from June, and by 37% from a year ago. In San Diego, sales volume collapsed by 21% in July from June and by 41% year-over-year. In Orange County, sales volume collapsed by 39% year-over-year, in Los Angeles County by 32%.
Price eventually follows volume, even in Southern California. In the counties of San Diego and Orange, the median price dropped for the third month in a row.
In Los Angeles County, the median price had peaked in September 2021 and has been on a wild ride since, up and down. But in July it fell, which was a bummer because it always rises from June to July; it even rose in 2009 from June to July, when all heck had broken loose, which puts this drop in a special light.
In all of California, supply of houses and condos for sale rose to 3.2 months, up from 1.9 months a year ago, and the highest level since May 2020.
The median time on the market jumped to 14 days in July, up from 11 days in June, and up from 8 days a year ago.
In the Bay Area, supply jumped to 2.5 months in July, up from 2.0 months in June, and up from 1.5 months in July last year.
The median time on the market jumped to 15 days in July, up from 12 days in June, and up from 10 days a year ago.
In Southern California, supply jumped to 3.3 months, up from 2.5 months in June, and up from 1.9 months in July last year.
The median time on the market jumped to 13 days in July, up from 10 days in June, and up from 8 days a year ago.
Median prices are very volatile, and we need to look at them with a good dose of circumspection, and trends need to be confirmed over time. But when the median price is down so far that the huge year-over-year gains in prior periods get whittled down to just small gains or even year-over-year declines, then the data points are starting to acquire heft as trends. And that’s what we’re now starting to see.
In the overall San Francisco Bay Area, the median price of single-family houses dropped for the third month in a row in July, is down 15.5% from the peak, and down 0.1% from a year ago, down year-over-year for the first time since lockdown May: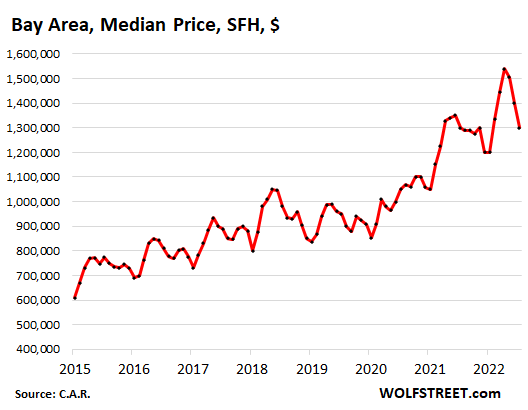
In San Francisco, house prices fell for the third month in a row, are down 17% from the peak and are down 8% year-over-year. These are very large and sudden declines, especially in June and July, and it rolled the median price back to where it first was in February 2018: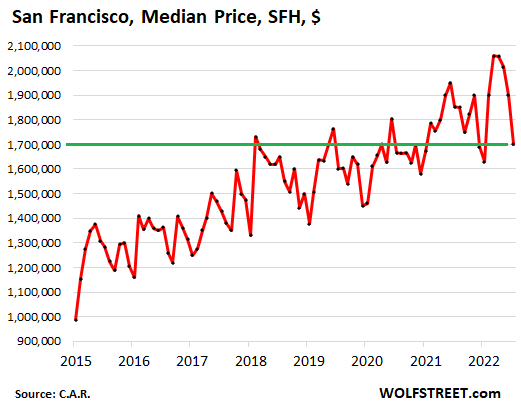
In San Mateo County, the northern part of Silicon Valley, the median price also fell for the third month in a row, -18% from the peak and -7% year-over-year. These are large and sudden drops that took the median price back to where it had first been in March 2021: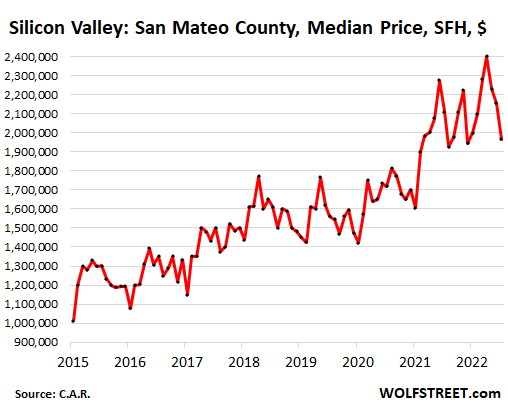
In Santa Clara County, which includes the southern part of Silicon Valley, the median price also fell for the third month in a row, -12% from the peak, but still +4% year-over-year, compared to the 20% gains last year: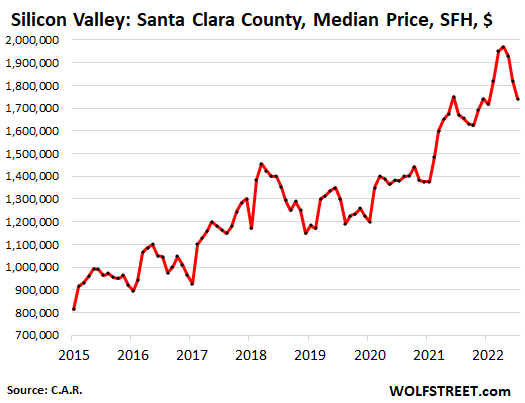
In Alameda County, in the East Bay, house prices fell for the second month in a row, -13% from the peak, but still +3% year-over-year: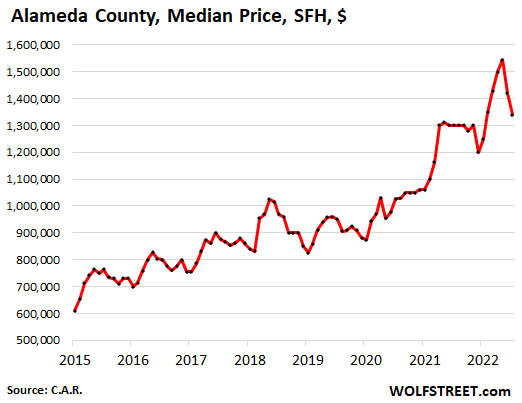
In Contra Costa County, in the East Bay, house prices fell for the third month in a row, -14% from the peak, -4% year-over-year: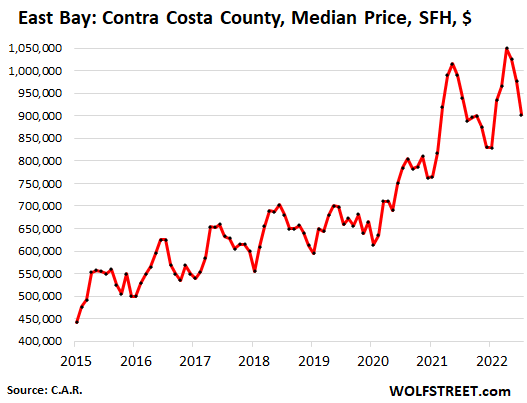
In Southern California overall, house prices fell for the second month in a row, -4% from the peak, but still +6% year-over-year.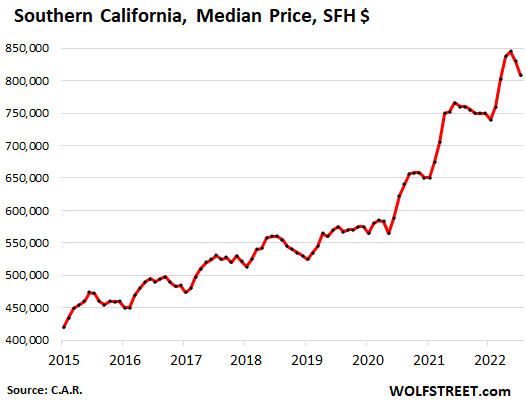
In San Diego County, the median house price fell for the third month in a row, -5% from the peak, which whittled the year-over-year gain from the 30%-range last year to +8% in July: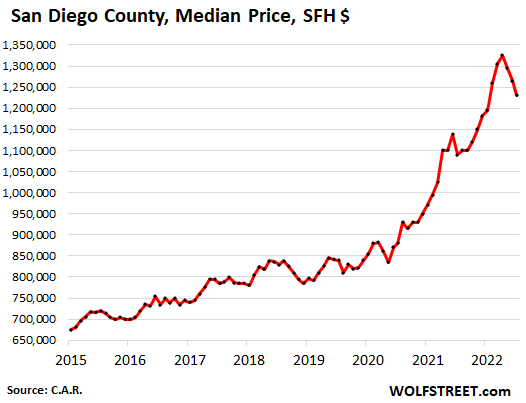
In Los Angeles County, the median house price has gone wild since the peak in September last year, -4.5% from that peak. Year-over-year, +4.5%.
But wait… special nugget: Seasonally, in LA County, the median price always rises from June to July, and this year’s drop in July from June was the first drop in many, many years. During the Housing Bust in 2008, the median price was essentially flat. And even in July 2009, as all heck had broken loose, the median price rose from June, which puts this year’s 1.6% drop in July from June into a very special light.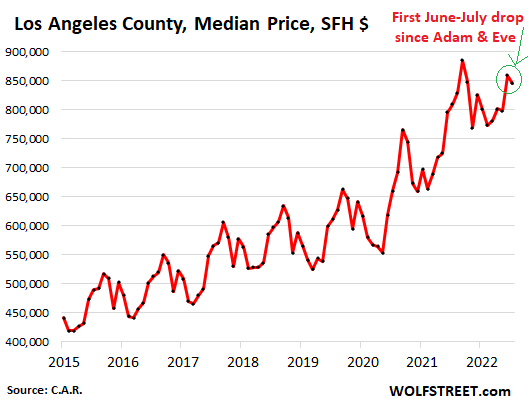
In Orange County, the median house price fell for the third month in a row, -7% from the peak, which whittled the year-over-year gain from the 27%-range early this year to 13% in July: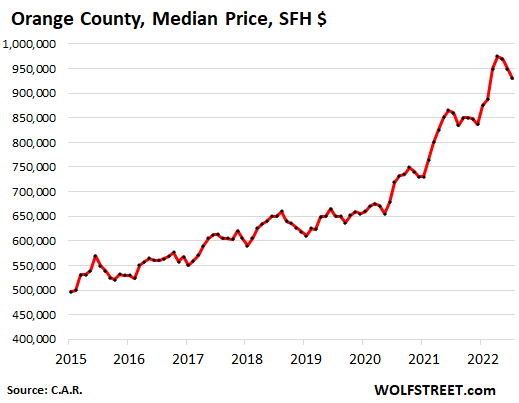
Enjoy reading WOLF STREET and want to support it? Using ad blockers – I totally get why – but want to support the site? You can donate. I appreciate it immensely. Click on the beer and iced-tea mug to find out how:

Would you like to be notified via email when WOLF STREET publishes a new article? Sign up here.![]()
Email to a friend
It’s bad in the Seattle area too, which is comparable to California in terms of tech influence and start-up activity.
For example, look at the median price single family home price declines in Redmond, WA (per Redfin market insights data).
Median SFM sales price:
April 2022 $1.95M
May 2022 $1.74M (6% monthly drop)
June 2022 $1.57M (10% monthly drop)
July 2022 $1.43M (9% monthly drop)
Plus, days on market is ACCELERATING UPWARD.
Want to lose money fast? Buy a home in an area that had 100% price appreciation the past few years.
Smart buyers will wait for signs of a bottom, as the bottoming process will take many months if not years. Don’t catch the falling knife.
Really?
That’s like a 25% drop in 3 months – that can’t be right.
That’s like 70% drop annualized.
Are you sure these figures are correct and meaningful?
Just doesn’t seem plausible ….
It’s median price data, so some of the downward trend is likely attributable to the mix of homes being sold. People can’t afford expensive single family homes anymore, so they are buying lower priced homes, or not buying at all.
If you have doubts about the data, go to Redfin, type in Redmond, WA, then go to the links for “market insights”.
The biggest advantage of living in Redmond is immunity to sticker shock : You can travel to Maui or Switzerland ir even an upscale part of Paris and then realize that your restaurant bill is similar to what you paid at Redmond, WA.
Most people now just drive out of city to eat out!
Thanks, Bobber.
One statistic they don’t seem to provide which might be useful for apples-to-apples comparison is the trend around price per square foot.
Dazed And Confused,
Not much difference. From the California Association or Realtors, Price per square foot, Orange County (because I just pulled the numbers for a reply further down):
July was the third month in a row of declines. Since April, the price per square foot fell 4.5%:
Jul: $630
Jun: $642
May: $656
Apr: $660
There were a number of houses sold for over $3M (!) in Redmond WA in April/May (Redfin will give you the data). It was a crazy times when we would go to an open house only to be told that it was canceled as the owner already accepted an offer only 3 days after putting it on the market. Things are definitely different now, and I hope it continues in that direction
Woodinville WA, another wealthy Seattle suburb, is just as bad.
Median price – single family home:
Mar 2002 $1.80M
Apr 2022 $1.49M
May 2022 $1.65M
Jun 2022 $1.46M
July 2022 $1.18M
Interestingly, these huge drops only bring the market back to where it was last summer. Thus, more drops can easily occur and may be likely. This is just the beginning of a trend that may spread across the nation over the next several months.
These bagholders can blame the federal reserve for continuing its quantitative easing program far too long, so that home prices became distorted.
Bobber,
“More drops can easily occur”.
You bet your sweet bippy they can.
A strong, strong argument can be made that the true clearing price will be in neighborhood of where median prices were the last 2 or 3 times when mortgage rates were above 5% (with semi honest loan applications).
That is going to be years or decades ago for most places, with a *ton* of faux appreciation to be unwound.
ZIRP created decades worth of financial illusions in the housing mkt.
RE your point below, the Redfin Data Center page provides the sales price per square feet data for all the metros they serve. Here is the link in case it helps anyone:
Yes, Redmond, WA is probably the only are falling faster than San Francisco!
Go to Redmond downtown and you see more than half of the shops shutdown. They had started converting malls to offices before pandemic hit and now even those offices are vacant.
The funny part is that many real estate agents still telling people that this is thr right time to buy!
If you really want to lose $500,000 in a year please buy a house at $2 million in Redmond, WA.
– As always: Prices follow sales.
– San Jose was down 8% down in the last 3 months and we’re talking prices.
I recall in the bubble that the price declines were huge the first year after the bubble popped. From there, prices dropped consistently but more modestly for several years. I saw it first hand. In late 2007, when the bubble started popping, the builder’s asking price of a house I was watching dropped 25% in three months.
I think this bubble pop will be similar in the speculative areas of the West and South.
Also note, prices are dropping fast in these areas even though transaction volume and supply is relatively low. It only takes one or two transactions in an area to bring everybody’s market price down. Smart sellers are capturing gains while they exist, beating the slow-moving sellers to market. This selling window will not last long because prices are dropping rapidly.
In my greater area the prices dropped more in 2010 – 2012. They were extremely low for about 3 months then they were sold bulk to all “cash” buyers. Banks would not give loans on them to regular buyers. “Cash” buyers being corporations that were given lower interest rates and foreign buyers.
It left a vile taste in many people’s mouths.
Money laundering of foreign corruption via US Real Estate?
What could possibly go wrong?
Just ask the people in Canada. Vancouver has a 30% tax on foreign Real Estate purchases. Too many people found that their kids could not afford to live in the town they grew up in. This has been routine in Marin County for years, but not in Canada.
” Vancouver has a 30% tax on foreign Real Estate purchases. ”
Finally! Good for them! & Yeah, we need laws like that here. I can’t believe the US population isn’t in as much of an uproar over this as they are in Canada, England and Australia. Why it isn’t a top political agenda. People act as if it isn’t happening like that.
Which was the reason so much Chinese money found its way into Seattle. It went from Vancouver to Seattle. The Chinese don’t buy into falling real estate markets so Seattle will keep on falling in price.
I hope the show has just started.
The home prices has much further to fall.
It may take a year or more I guess.
People say, home prices decline is not good. I don’t see it this way.
I am a home owner and if my home prices goes down by 40% or so or more does not impact me.
If you are an investor, its a different story.
If home prices fall enough, I can see families living in their own home instead many families sharing single home .
Lower house prices mean lower property taxes.
Lower taxes??? I don’t think it works like that.
Not necessarily in Chicago / Crook County / collar counties. Those pensioners and heath care bennies have to be paid.
“Those pensioners and heath care bennies have to be paid.”
NO, they DON’T. Taxpayers never got to vote on that. As far as I’m concerned, it’s stolen money.
Your home is not an investment, it is where your family live and enjoy each other.
Phil-sadly, that memo got lost almost two generations, ago…
may we all find a better day.
Exactly. Congress made sure to change all that with laws that made homes into *very* attractive investment assets.
A house is a liability and a headache I don’t need. I already have a job, don’t need more chores. The american house ownership dream sounds like a nightmare when you realize what is involved. Also you don’t own it, the bank does, and the government can take it away at any time if you stop paying for ‘protection’. I’m opting out, and quiet quitting. No point working hard when nothing is going to come of it anyway. Don’t want to make my boss rich 😉
Unless you want to live rough, you need a place to live though, so they gotcha.
I agree.
Home price decline is not different for an investor unless they are short-sighted and only bought for appreciation instead of the more important and longer-term benefits. Rents are up and going higher so who cares if the home is worth more or less? I don’t, but then I’m a long-term kind of guy.
I’ll even say that the investor is better off than the homeowner because if the homeowner loses a job they might lose the home, but if the tenant loses a job you can rent to the other one that still has one.
I suspect that smaller homes/condos will retain their value more than larger, more expensive homes over time. Many larger homes were bought to house large families, but most baby boomer’s children have left their homes now. They do not need such large, luxurious homes.
Reportedly, the baby boomer generation is retiring now, albeit a report says that the last ones will retire by 2030. That will mean that many will want to get rid of their larger homes to have money to live, given their limited retirement savings:
See Investopedia quote from “Are we in a baby boomer retirement crisis”:
“Baby Boomers have an average of $152,000 saved for retirement, according to the 19th Annual Retirement Survey of Workers conducted by the TransAmerica Center for Retirement Studies. This is not nearly enough to last through retirement. Based on information from the Bureau of Labor Statistics, adults between ages 65 and 74 spend, on average, $48,885 a year.”
That is what I predict will happen, and I predicted the Chinese economic crash that is now occurring many months ago.
Anyone care to guess how the current house price declines will impact the “Owner’s Equivalent Rent” component of the CPI in 2023? If I’ve read Wolf’s prior commentary correctly, the latter should continue to rise for many months, but maybe the former will temper it.
We saw that during the housing bust that “OE of Rent” (red line) kept going up (except for a minor hesitation) even as home prices (purple line, Case Shiller) were crashing: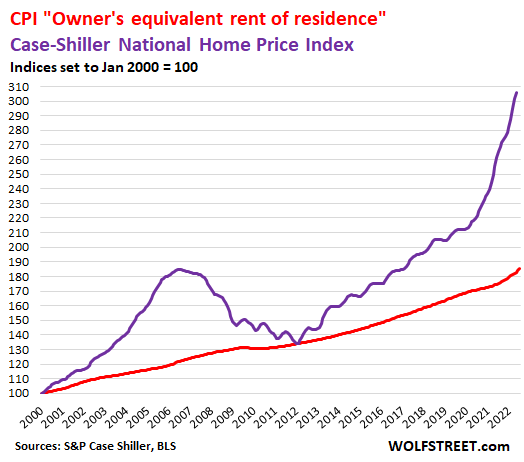
Another compliment for your awesome chart, Wolf!
When CPI “Owners Equivalent Rent of Residence” intersects with the “National Home Price Index” like it did in 2012, I will hopefully have cash to buy RE.
I don’t understand why CPI is not spiking? Rents have spiked ridiculously based on the renters I know. Thanks to Wolf, I do understand the calculation of this CPI has a lag and is based on owners estimate of what they think they could get for rent. When the tax collector calls me for this information, I try to lowball the number since I am not renting out my house and I don’t want my property taxes to increase. I guess I’m paranoid and not a bragger.
It may be interesting to also show the real-time Zillow line for their rents.
Forgot that this is owner equivalent rents, derp. Maybe another chart out there tracking case shiller to overall rents? But I am guessing if that looks like owner equivalent, then it again says rents driven by rental market, which is not materially correlated to housing market.
So idea that institutional investors buying homes to lock would be buyers into rental servitude, which I have read in the comments from time to time, seems unlikely.
“Slight of hand” on gasoline prices before the midterm elections is artificially pushing down the CPI but inflation will take a second leg up at the very beginning of 2023 as oil and gasoline prices spike.
Cool chart! Rents to home prices don’t look correlated at all in this chart, so I don’t know why everyone assumes continued rent spikes. Where’s even the correlation in the data, let alone causation?
I guess this makes sense. They’re not really the same markets. While there is some small substitution towards the higher end of the rental market, most folks who rent do so because they cannot buy. Few are renters by choice. Few homeowners are looking to take profits on homeownership and rent if they got kids. There is no waive of foreclosures forcing people out of their homes.
So, the biggest explanation for all the extra volatility over the last 20 years with SFH compared to rents is mortgage rates and income volatility, both heavily impacted by fed policy. Demand is driven more by how much people can borrow rather than fundamentals like intrinsic value, income generated from asset, etc.
Imagine being there at the end of 2018, looking at these charts, noticing a dip, and then start crying chicken little about how the whole markets going to collapse, the bottom’s going to fall out, this time it’s NOT different, 10 year cycle, interest rates are a disaster, there’s massive surplus, the american dream is over.
What?
I think the point is whocoodanode then that prices would run up 3 more years.
I’m in the Naples market. Listings for SFRs bottomed in March 2022 and have increased about 180% by mid-July. I expected those trends to continue through the balance of the summer and into the fall. However, listings started decreasing in late July and have continued lower in August.
While I think prices may decrease by 30% from the peaks in March, those levels are still up 85% since Jan 2021.
I see bottom prices based on a price level which is 5.75% annual appreciation applied to the 2012 price baseline.
I would say 4% and not 5.75% if it was not Florida, and especially if it was not Naples (i.e., white sand beaches, clear water, a lot more upscale and refined than pretentious Boca Raton).
Wolf, you have the months reversed in this sentence: “Sales volume of single-family houses (SFH) in California plunged by 14% in June from July”
Thanks 🤢
There’s no better houaing indicator to me than the window of the BRK real estate office on my street in a near Chicago suburb. Once full of million dollar homes, I saw the first rental property in 2.5 years on the glass. Nothing over 500k. And listings sitting for longer. Real rates mean real loans and really paying attention to prices. Potential for losses, holding costs, low liquidity, it’s scaring away those all cash second home or blackstone-esque buyers.
The main force holding the Chicago burb market up are all those young couples with a kid or two fleeing the nice hipster areas of the city ‘for a big back yard’.
We live in an expensive area for housing (Cambridgeshire, England). For years we’ve been getting letters from agents assuring us that armies of refugees from London would like to buy our house and that the agents would be delighted to handle the sale for us.
If we stop getting such letters I’ll know we’re “doing a California”.
Very low inventory here in SD and I dont see any price decline.
If a decent house comes to market, still sells quickly.
Prices might stagnate at those levels but I see no bust, the amount of money printed in the last three years is still out there and isnt being withdrawn, so we got 30% dollar devaluation basically and very high prices.
I get lots of emails from redfins about price reductions in san diego.
I never saw these many in last 3 years or so.
I guess we live in different san diego :-).
BTW, anecdotes aside, numbers don’t lie.
A lot of people in san Diego told me the same in 2007-2009: That San Diego is so nice , come what may, prices would never go down.
The rest is history as they say.
Everybody thinks their area is special and will never correct…until their special area corrects.
“Not in my city.”
“Not in my neighborhood.”
“Not on my street.”
“Not my house.”
Part of the grief process – denial and bargaining, followed by anger and acceptance.
The rapid increases in home prices is still hard for me to stomach, even after watching it the whole way through.
Things have clearly reversed, and the reversal has a long way to go. Who wants to pay 5-6% mortgage interest rate on a home that is declining in price? It’s a recipe for financial disaster. Potential buyers in the South and West should at least wait a year until price trends stabilize. Prices seem to be falling like a rock right now. Also, the job picture seems to be tightening for professional positions, particularly in start ups and tech.
I kind of feel that way about the auto market. It seems like a complete scam – a ripoff.
I sold a house in 2005 in Northern California. My neighbor uttered almost the exact same words ,” they might level off but never go down”. I bought a house about 5 miles away for $185k in 2012. It had topped out at $500k in 2006. It was a beater, but I added a lot of sweat equity. It actually set me up financially for my retirement. Last year I took a reverse mortgage on it.
You got lucky. You had no way of knowing the FED would be so reckless and push prices like they did. And this “reverse mortgage” thingy….
1) San Mateo, the leader of the pak, is in a trading range since reaching $2.3M in 2021 and plunging to $2M. Breaching the $2M low means weakness, not a collapse. It might happen more than once.
2) San Mateo is either in distribution, or accumulation.
3) The rest, premature.
4) San Mateo RE might be in troubles if AAPL breach June lows and stay below, bitten by the snake river bankers , US consumers, or China.
2000sqft SFR homes here in South Orange Co. were about 1M in November. That went to 1.4M by May. Now they’re around 1.2M. But they’re all still selling. So I have no faith that the prices will ever get much lower.
You gotta be patient. Last one took about 5 years to play out. For instant gratification, you can go see a crypto rug-pull, or a meme-stock BBBY dump (-41% today), but that’s not likely with real estate. Real estate takes time. And these are pretty fast moves already.
This time, because we are in an “everything bubble”, I suspect it may be faster than usual.
I know you’re right, it’s just frustrating to watch prices go up 50-100% in 2 years just when we finally save up 20%. Thanks for the advice.
“You gotta be patient. Last one took about 5 years to play out. For instant gratification, you can go see a crypto rug-pull, or a meme-stock BBBY dump (-41% today), but that’s not likely with real estate. Real estate takes time. And these are pretty fast moves already.”
The system is much more unstable now with the amount of debt and speculation in the system. I believe this one will turn into a dumpster fire of unimaginable proportions. There is virtually no room for the Fed to double its balance sheet to save the system again. Our international creditors will make sure of that.
“For instant gratification, you can go see a crypto rug-pull…”
This made me laugh out loud. Wolf has a way with words at times. For the life of me I have no idea why any crypto is even worth a dollar anymore. WTF is a Dogecoin, anyway? Can anybody name anything this “coin” does?
I’ve been watching price/sqft rise every month in Orange County, CA.
Price/sqft factors out the mix of housing sold and the violent price swings. For example, someone could sell 60 condos one month, pulling down the median price, when in fact the price/sqft has gone up.
JeffD,
OK, look again.
July was the third month in a row of declines. Since April, the price per square foot fell 4.5%
From the California Association or Realtors, Price per square foot, Orange County:
Jul: $630
Jun: $642
May: $656
Apr: $660
Using stats against people how rude. 🙂
Time to eat crow. I look at movoto market trends, for my data. For the first month, in *August*, $/sqft are down. I’m shocked.
JeffD,
The link you provided was for Costa Mesa, a small town with 16,000 souls. Orange County has a pop. of 3.1 million. The town is too small to have any relevance here in this article.
There are just 139 houses on the market, per your link. And the median days on the market is 6,696 days, six-thousand six-hundred and ninety six days, which is something like 20 years I think, which is kind of long-ish. Not sure about the accuracy of their data LOL
Hi Wolf,
Costa mesa has 120K population. I gave the link for that city because movato has”nearby city” data at the bottom of the page, in case you wanted to compare to the general area. Aliso Viejo is another southeast county that is a good base city in movoto for that “nearby city” comparison. The “days on market” is clearly bogus. 🙂
Time to eat crow. I posted a link in a moderated comment you can read and discard. The west Orange county and southeast Orange county markets are very different. Here in southeast Orange county, it looks like the monthly $/sqft is finally coming down in this last month, and be almost 5%! Looks like interest rates are actually working.
Hi Wolf. Today I somehow caught your interview by Adam Taggert – Wealthion from 3 months ago. You have a great crystal ball!
el-cheapo plastic version from Walmart
The problem with California is that it is in California.
Wow, how very profound and additive to an otherwise great thread of helpful comments.
One may wonder where you chose to dwell, but then who cares.
Several price cuts per day here on the Olympic peninsula. More inventory daily. Homes are selling but most on the cuts.
It did get crazy hot up here for three years. Houses doubled in less than 24 months. San Juan island really went nutters since 2020 and it’s dead in the water now
In March Zillow predicted that houses will appreciate 18% yearly, in June they reduced it to 7.8% and in July to 2.4% according to an article that I read today on Fortune. That’s hell of a change in just 4 months.
How much zillow’s prices prediction would be next month? My guess: 0.0%
Take a look at inventory in other western cities like Phoenix or Boise. Take a look at Austin.
Pre-covid inventory at post-covid prices at double the interest rate LOL. Wait til the job market cools, that’s when the real fun will begin. San Diego? Scarce transactions = scare RE commissions and loan origination. No refis at these rates. Realtors and mortgage brokers income heading down down down.
I heard Adam & Eve were doing a real estate flipping show on tv, but got banished after a staging expert got bit by a serpent.
Liability insurance in Hollywood has limitations on what pets are allowed on set. They needed a special addendum but the couple don’t have deep pockets so they couldn’t afford the coverage. I think the humane society even got involved in this debacle.
One site shows 7 of the 10 most expensive U.S. cities are in California. They base this on the home price to household income ratio. L.A. and San Francisco are the most expensive in the nation. This may be why people are leaving California.
The Midwest has the most affordable housing.
Basically where people want to live is where it’s most expensive.
Adam & Eve didn’t have very deep pockets. They wouldn’t be able to afford much that’s why they hang out in people’s gardens. I’m sure they’d give their collective shirts off their backs to attain a nice home where they don’t have to be worried about sunburn.
Huntsville Al is booming : Boeing, Raytheon, Airbus, Toyota… real stuff
I wouldn’t drink the water anywhere near the first two.
Yay!
Thank god. I own two properties in San Diego but have been waiting to buy a new primary residence in a nice central area with good schools. Unfortunately for San Diego that means 2.4M price tag right now. Waiting for this market to correct so I can have something to get into.
Many of those fleeing CA are heading to central Ohio. I believe we may become the little bubble that could. Houses are getting multiple offers, prices over asking, and contingency is waved. It’s a weird world right now!
Presumably a consequence of the Intel boondoggle, right? Very sorry to hear this. Sounds like morons from Cali are coming in and tearing a big ahole into the buckeye state. I bet natives will ultimately be sorry about this when they’re all priced out by the calidiots.
“Drive ’til you qualify” on steroids. I’ll never forget passing through the Ohio River Valley and seeing the shanties to the side of the highway.
The real question: At what point do climbing rents clash with falling house prices. The rent/buy tradeoff will keep somewhat of a floor under housing – as long as rents keep rising – which in general they seem to be doing (in our area at least) – and if wages also rise this puts a floor under rentals.
Of course if and when economic reality finally kicks in and unemployment actually starts to increase then we see real moves.
There are so many empty housing units right now that I expect rents to absolutely crash through the floor in the next few years.
Is there any way to cut the data based on where in a county you are? I don’t know if Redfin or the data gets that granular.
Wondering if (let’s take North County SD or OC) are these cuts are more pronounced for those still listing properties 5-10 miles from the ocean like the market hadn’t turned. Is it more acute the further inland you go? Or are properties west of 5 seeing the same level of haircuts?
Would be fun to put the “coastal SoCal RE is more bulletproof” theory to the test as these trends play out. Some of these counties are so big.
The locust landed on our statues, on our fathers graves, on the
the retail stores, on our cities, on the media…the 2008/2022 locust era might be over.
Time on market is still surprisingly low in most of those markets despite the median sales price declines, indicating properties are still selling at a decent clip despite surging inventory. The fact that median sales prices are declining as fast as they are is notable. It’s also comical how expensive the cost of living is out there. 99% of Americans are basically priced out of those markets. Make 300k a year? Bummer, you’re still broke in SFO!
Your email address will not be published.
Buyers moseyed away from sky-high prices but are still there, just a lot lower, while many sellers hang on to illusions.
Last time it tried to sell the building was in 2019. Now the office market is an entirely different ballgame.
No, consumers didn’t suddenly flock back to the mall. That was just a media joke. They bought online more than ever. Sales at department stores fell.
The years 2020 and 2021 will go down as the greatest era ever of consensual hallucination and financial gangsterism.
Starts: Single-family houses: -18.8% year-over-year; larger multifamily buildings: +15.9%. Here are the long-term trends.
Copyright © 2011 – 2022 Wolf Street Corp. All Rights Reserved. See our Privacy Policy
Powerful Wealth Building Resources


