THE WOLF STREET REPORT
Imploded Stocks
Brick & Mortar
California Daydreamin’
Cars & Trucks
Commercial Property
Companies & Markets
Consumers
Credit Bubble
Energy
Europe’s Dilemmas
Federal Reserve
Housing Bubble 2
Inflation & Devaluation
Jobs
Trade
Transportation
The plunge in home sales is just stunning. Sales of new single-family houses collapsed by 12.6% in July from the already beaten-down levels in June, and by nearly 30% from July last year, to a seasonally adjusted annual rate of 511,000 houses, the lowest since January 2016, and well below the lockdown lows, according to data from the Census Bureau today.
New house sales plunged in every region compared to July last year. Note the West, oh dear: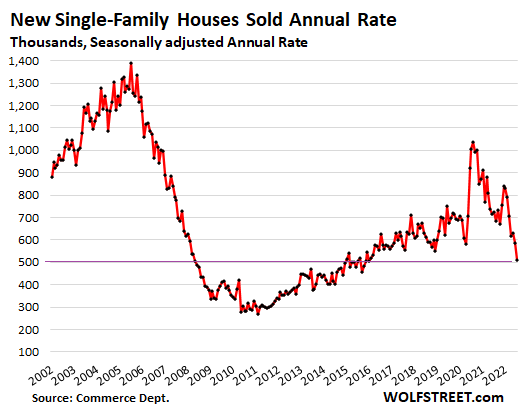
A similar plunge, but now quite as bad, occurred in sales of previously owned homes, which plunged by 20% across the US in July compared to a year ago. In California, sales of existing homes collapsed by 31% year-over-year; and in the previously hottest market, San Diego, by 41%!
Sales obviously would be a lot higher if prices were a lot lower, and more people could actually buy at these mortgage rates – today, the average 30-year fixed rate is at 5.7% again, according to Mortgage News Daily – but it takes a sustained plunge in volume to hammer the message into increasingly motivated sellers what they need to do if they want to sell: They have to go where the buyers are, and the buyers are a lot lower.
Homebuilders know this because they have been lamenting for months the plunge in traffic of prospective buyers, according to the survey of homebuilders, conducted by the National Association of Home Builders: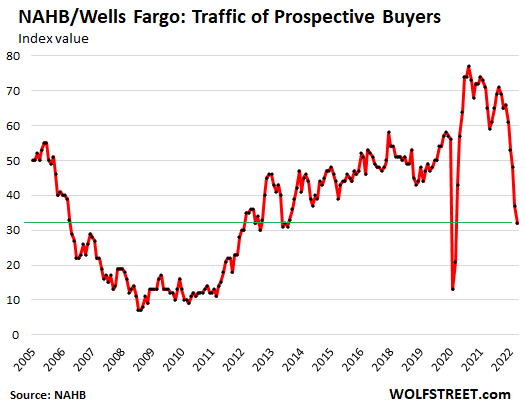
Inventory for sale in all stages of construction jumped to 464,000 houses, up by 28%, from July last year, and the highest since March 2008: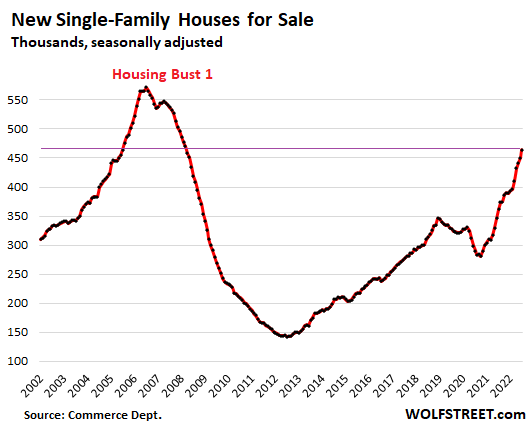
Supply of unsold new houses spiked to nearly 11 months of sales, on this surge in inventory and the collapse in sales. This was the highest since the worst months of Housing Bust 1 in late 2008 and early 2009: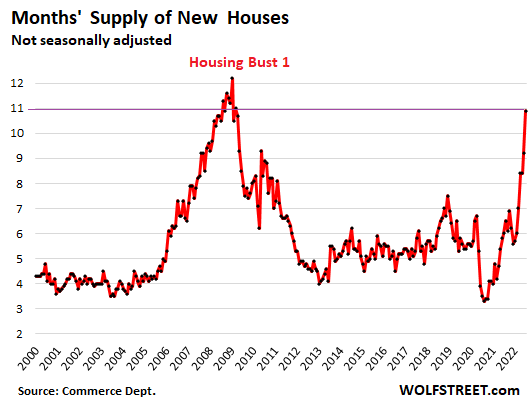
By region, unsold inventory jumped in three of the four regions, in terms of the percent increase year-over-year:
The median price of new single-family houses that were sold in July rose to $439,000, not quite undoing the plunge in June. This was down by $20,000 from the peak in April, whittling down the year-over-year gain to 8.2%, the smallest gain since November 2020. In a moment, we’ll look at the three-month moving average, which gives a clearer picture: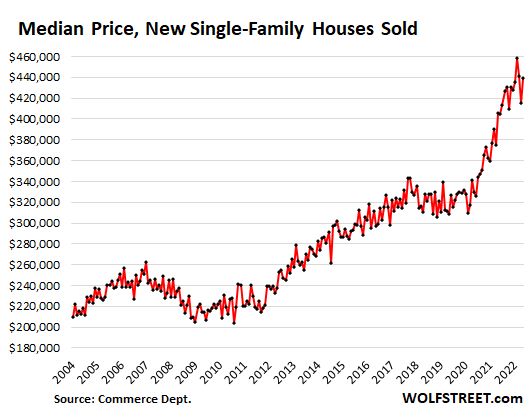
The three-month moving average, which irons out some of the month-to-month ups-and-downs of the median price, fell for the second month in a row, the first such declines since the lockdown months.
Note the crazy price distortions since then. And now with much higher mortgage rates, at those crazy prices, sales volume has collapsed, cancellations have spiked, traffic of prospective buyers has plunged. If builders want to bring in buyers and sell houses, they’ve got to cut prices – and by a lot: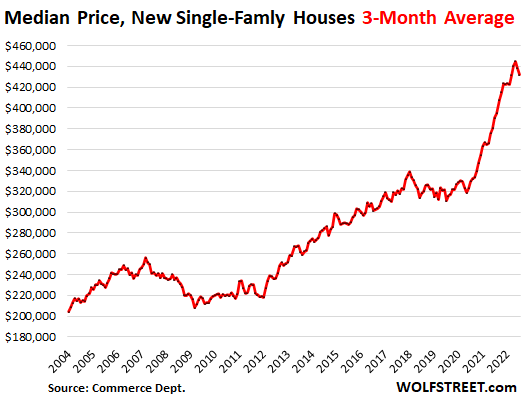
Over the past two years, spiking demand for new houses triggered astounding spikes in prices and shortages of materials and supplies, combined with a labor shortage that have delayed projects and inflated costs for homebuilders, and they passed those surging costs on to their over-eager customers, no problem, until suddenly customers balk, which is now.
Demand by homebuyers has collapsed by 30% year-over-year to multi-year lows. And homebuilders are throttling back their demand for materials and supplies, and suddenly the crazy price spikes abate.
Construction costs of single-family houses – excluding the cost of land and other non-construction costs – ticked up only 0.4% in July from June, according to separate data the Census Bureau released today. Although that’s still big increase (around 5% annualized), it was by far the slowest increase since November 2020. The month-to-month increases had peaked at over 2% late last year, and in May and June were still at around 1.5%.
This whittled down the year-over-year spike in costs to 16.8%. Beyond the spikes this year, it was still the highest in the data going back to the 1960s. The previous high was in mid-1979 at 14%.
This chart shows the actual construction cost index and the cumulative nature of those price spikes. Note that during Housing Bust 1, construction costs actually fell – and this might be happening again as homebuilders cut back and demand sags.
Note that none of this goes into CPI inflation. The housing costs that enter into CPI are based on rents.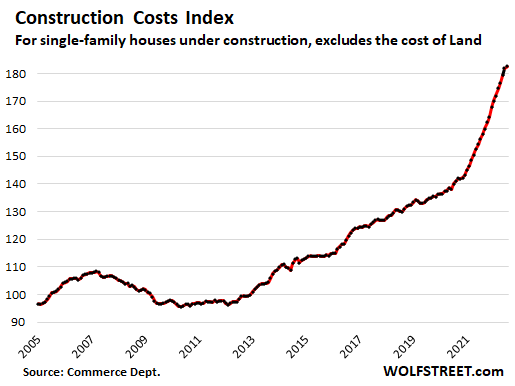
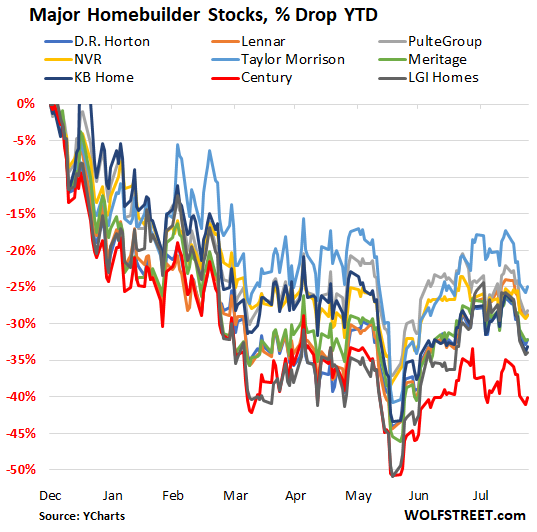
The stocks of homebuilders are down between 25% and 40% year-to-date, despite a powerful summer rally, and have by far out-dropped the S&P 500 Index (-13% year-to-date):
Enjoy reading WOLF STREET and want to support it? Using ad blockers – I totally get why – but want to support the site? You can donate. I appreciate it immensely. Click on the beer and iced-tea mug to find out how:

Would you like to be notified via email when WOLF STREET publishes a new article? Sign up here.![]()
Email to a friend
Top notch as always! Things look pretty bleak for the new construction market. What are the chances rates stay high enough for long enough to really pressure sellers to lower prices? I’d love to see the 10 year get to and stay at 4% or more.
Tol Brothers report after the bell today. I twill be interesting to see what they say.
The builders that reported at the end of july were seeing rising average prices, big backlog, but slowing sales. But that was about 1 month ago
Yes me too. We’re in contract with Toll Bros to buy our house/Lot (as well as our 3 neighbors lots) to put up new construction here in north Seattle. We’ve been starting to sweat that they’re going to pull out.
Real estate agents earn from commissions on sales and the sale numbers are collapsing.
Sellers agents for home owners are somewhat able to convince sellers to lower price to make sale hence the sales collapse is only 30% in West.
However builder’s that have higher cost on new construction are just not ready to make any concessions, even to their own seller agents, hence the 50% collapse.
Why do new home builders remain so disconnected to reality. Do they have insider info on Fed Pivot regarding mortgage rate and MBS sales, or are they just hallucinating?
As buyers and sellers remain far apart on price, Winter seems to be coming for RE agents.
ru82,
Toll Brothers this evening lowered its guidance for deliveries for the year by about 10% from its May guidance, blamed the “softer demand environment,” higher mortgage rates, labor shortages, and supply-chain problems.
Its new-home deliveries for the quarter were below guidance.
Orders, in terms of the number of homes, plunged by 60% in the quarter from the prior quarter.
It said, as the quarter progressed it saw “a significant decline in demand as the combined impact of sharply rising mortgage rates, higher home prices, stock market volatility and macroeconomic uncertainty caused many prospective buyers to step to the sidelines.”
The West.
Is.
Distressed.
(Apologies to the Lizard King.)
Ha, no, what I see instead is that buyers finally woke up and went on a buyers’ strike.
They should have done it two years ago (instead of elbowing each other out of the way to bid up prices), and we wouldn’t have had this kind of debacle: sky-high prices that must now get unwound manually.
“Ha, no, what I see instead is that buyers finally woke up and went on a buyers’ strike.”
I still see many sellers who are in denial: “Our house is special so we can ask more than the comparables on the market that sold 6 months ago.”
I have seen the shift in buyer mentality as Wolf has mentioned many times, but many sellers still don’t budge.
In West, RE agents can’t figure out that buyers and sellers are far apart on pricing. I interviewed four agents and only one could correctly point out that a specific house in market for 57 days will actually sell for 20% (i.e. $350,000) lower than list price that was set according to pandemic peak. The others felt that they can save me between 5K to 30K through their negotiations.
No prices for guessing which buyers agent made my shortlist.
Vintage FOMO!
You just said what I was thinking about, and Wolf was mentioning this for past couple years in his articles.
Maybe it’s time we update the term Mexican Standoff to American Standoff. Buyers and sellers currently have very different and stubborn views on pricing.
We’ve seen this before in some markets. Rancho Santa Fe (San Diego) was the canary in the coal mine for the last bubble. Around 2003 or so the bid/ask spread was so wide that the market was more or less frozen. That abated maybe 5 years later, but really until 2020 that market still was really tough to ever buy or sell. It’s headed back that way now.
“They should have done it two years ago (instead of elbowing each other out of the way to bid up prices), and we wouldn’t have had this kind of debacle”
That sounds like victim blaming.
Unlike a car, purchasing a house can not always be postponed – kids, schools, aging parents and so on.
There was a crazy Fed that kept buying up MBS in hundreds of billions of dollars in the hottest market. Pumping up prices, creating FOMO. With no end in sight.
(I don’t have much sympathy for the investor class. They should have waited out the craziness or been prepared for houses losing value)
You can always rent.
‘You can always rent.’
Yeah, a State Park camp site, for a few days, mid week, if you get your reservation in a few months ahead.
Good luck finding a rental place without selling half your liver (kidneys don’t fetch enough). Hope you don’t love your dog or cat too much either cuz landlords are funny in their dislike of pets. Kids might be a problem too, that one’s always fun.
Lilli,
You are describing the rental mkt of 2021-22.
Not the rental mkt of 2002-2020.
Except for NY and CA…which have long been insane by their own hand.
Nacho,
“That sounds like victim blaming.”
We’re not victims in the textbook sense. The Fed gave us the matches, but we didn’t have to play with them in a dry grassy field.
Easy for you to say.
We are not talking about the crypto market, which one can safely sidestep. Housing OTOH is essential.
Imagine being the young couple who kept saving every year for their first house and prices outrunning them year after year. Imagine plopping increasing amounts in rent and gaining no equity and no stability. Imagine their fear home ownership will forever slip from their hands. Imagine their horror of looking at continued ginormous stupidity of the Fed fueling up the rally.
So why did people stop buying now if they couldn’t stop buying the last 2 years?
Nacho,
“Imagine being the young couple who kept saving every year for their first house and prices outrunning them year after year. .”
I don’t have to imagine. That was me (us) for 20+ years. It sucked and was infuriating.
“Imagine plopping increasing amounts in rent and gaining no equity and no stability. Imagine their fear home ownership will forever slip from their hands. Imagine their horror of looking at continued ginormous stupidity of the Fed fueling up the rally.”
To that I would say 1) home ownership is not a right, nor the end all, be all, and is not for everyone. Much like college. Renting in many ways is way better. 2) Have patience. Said couple you describe needed to wait for the stupidity to end, because it has to (and is just beginning to reverse). I’m not completely sympathetic to young couples “desperate” to buy in their 20s. Patience!!
One can always rent.
Mr Home Joe not risen!
Jimmy M is chuckling. 😉
The Chinese the main buyer of new homes only buy when prices are rising not falling. Seattle should see major fallout.
In Tucson market – realtor friend said 1/2 sales still all CASH
even sale that fell thru due to financing in May is now going thru(buyers got real lender)
and at same price
as of Aug 1 – still little inventory(19 days)
Well, that is fallout false. All foreign buys are 2.6% of the used home market, and the Chinese are only a small % of that rounding error.
A recurring theme is ‘tighten ok, but don’t cause a recession.’
There is no alternative to a major correction in housing, and you can’t have that without a recession. Real estate is not a single industry, it is a constellation of industries, from people handling paper work to people handling drywall. That’s why during the boom the economy is so hot: there is a job for everyone.
In other times, maybe housing could take a major downturn without a recession at all. Not now, after 10 years of the financialization of housing. We have put too many eggs in that basket.
Interested to hear you say more about “10 years of the financialization of housing. We have put too many eggs in that basket” if you care to. I’m not sure what that means. TIA.
I think I can elaborate. What Nick is eluding to is that when times are “good”, the demand for homes is so ferocious that it creates massive amounts of jobs in the industry. Suddenly you need more truck drivers, more drywall guys, more painters, more carpenters etc. This demand has been artificially created by the Fed, buying MBS right off the market. This absurd monetary policy has led to an artificial demand in many sectors of the construction industry, due to investors purchasing, building, and remodeling homes. If the values of the homes weren’t being backstopped and artificially pumped by the Fed, you’d see lower prices, but less jobs in the construction industry. The Fed sees this “boom” as beneficial. Its absolutely not, and unfortunately when the Austrian business cycle inevitably comes for this market. . . the Fed will be to blame for blowing up a basic need for Americans into an over invested, over fictionalized, and over jobbed “asset class”.
Over financialized*
And worse, the Fed-induced artificial demand (see ZIRP and “affordability”) really didn’t result in building that many new houses (if it had, the insane rent inflation of the last two yrs would not be occurring).
What it *did* do was make some homebuilders very, very rich by empowering them to jack prices way up (regardless of production cost) and keep the all important *monthly* mtg payments constant (thanks to DC destroyed interest rates).
If you want to understand the corrupt dynamics of subsidy, just think student loans and FoS colleges that have grossly inflated tuitions for 40 years.
(Appropriate analogy on the eve of Biden’s enormous kickback to one of his most doggishly loyal and utterly corrupt constituencies…the limousine liberals of academia).
At $439K, maybe the top 20% can “reasonably” afford to buy a new median priced home. By my standards, noticeably less than that.
Per a teacher friend of mine, our local school district is having trouble finding new teachers because local housing prices are too high and rents impossible to find.
Home health care agencies (among other health services) are struggling to find not just home aides but now nurses, Physical & Occupational Therapists, etc. who tend to make a bit more than teachers and still can’t afford housing or daycare, plus all the gas to drive around solving mysteries all day.
Even the tax dediction per mile has not risen remotely close to the gas prices. And agencies, who usually reimburse an additional few cents above the fed rate, aren’t rising to it either. The NIMBYs are livid they can’t get their elderly parents’ home care services as if a doctor’s order makes a PCA magically appear. Patients are suffering and its just horrible.
In Chicago, the cheapest places to live are also the worst (high crime, shootings, etc). Chicago public school teachers must live within City limits to teach, to keep the taxes in the City. My husband is a teacher and we are stuck renting to be in a good school neighborhood. The school district would apparently rather hire uneducated teachers for low pay rather than hire qualified teachers who reside the suburbs. The cost of living and taxes are too high here for a teacher with a family to live comfortably. Teachers end up living outside City limits and lying abt their actual residence. Too expensive.
So what can be done?
1) Prices could plunge 30-50% in a job-loss recession where people foreclose on their new houses and people don’t have jobs to buy houses. This will primarily affect people who purchased in the last 2-3 years. People who purchased before 2019 are up at least 30%.
If only people would hang in there instead of walk away (2008), the economy should be stable.
Or
2) Inflation can raise wages 20% so people can afford houses again. Throw in a 10% plunge in prices to take us back to March 2022.
This benefits the working middle class. It may hurt the rich with multiple houses if they lose 10% in housing and 20% in the stock market but they should barely notice it since it only takes them back to 2020/2021 with net worth.
I still think Jan 2022 to Jan 2023, house prices will be flat or up a little.
I am in san diego and i can tell home prices either would remain flat or go bit higher as we are special and this time is different than 2008-2012.
BTW, home prices have to go down quite a lot than 10-15% reduction to make it affordable.
Unemployment is 3.5%.
In the greater Toronto area up in Canada you’d be hard pressed to find any building lot for a price as low as $439 thousand Canadian.
I bought a gorgeous 1.4 acre lot earlier this year in Tucson, AZ for $100k it’s in an old neighborhood with mostly houses built in the 1940’s. There’s no HOA or other restrictions, I’m building a modest 2 bedroom home but the some of the neighboring homes are quite impressive
So what’s next in horizon for plunging prices?
As much as it pains me to think it as a citizen it means regime change and if Trump is elected expect rates to plummet and prices to recover. Asset inflation helps those with assets. Those with assets vote and give assets to politicians. The government gets more taxes with asset inflation and the national debt goes down and there is an open checkbook to fight Russia and China. If Biden is reelected rates will drop but not as fast as with Trump….everything will look more organized but will be the same CF with better actors. The savers are going to get crushed until there are none left.
To amplify that final point – it’s rents that are in CPI, not house prices. The effects of new-home sales on rents are indirect and slow.
Short term, the sales-rate collapse for houses (both new and existing) constrains supply … that won’t reduce rents.
Longer term, sellers will have to drop prices unless rates come back down. A downward price trend motivates holders of 2nd homes to sell, so that will increase supply.
But the Fed moved too late. Now we’re heading into the winter quiet months for house sales. Owners will sit tight until next spring’s selling season, and pray for a Fed Pivot to save their profits. If no Pivot, prices will be lower by spring and maybe we see more supply come out of the woodwork next summer.
Lower-priced supply will eventually maybe pressure rents, but there’s a lot of pent-up demand. At best it seems like it’ll be at least a year before rents fall and feed into CPI.
Maybe other parts of the economy will have more immediate effects on CPI…
It’s not just YoY numbers that the Fed and others are watching though… MoM numbers do tell us where inflation is heading. If prices continue to increase, that impacts the monthly numbers pretty quickly. But if rents simply flatten out and stay the same from one month to the next, that’s effectively 0% inflation in rents. Asking rents may take a little while to follow housing prices down a bit, but they’re pretty sensitive to economic conditions, namely wage growth. If people can’t afford the rents being asked, they won’t rent or they shack-up together which increases rental inventory. Landlords don’t want to simply sit on empty houes and apartments with carrying costs, so they’ll adjust to meet the market. And that market has already started to cool significantly.
The Fed moved as they intended to move. They would NEVER intentionally target a decrease in prices of products, services, and assets (deflation). They don’t like too much inflation, but deflation is their worst nightmare. They are gunning for disinflation. That is less and less inflation until we return to their arbitrary target of ~2% annualized. It’s a one-way ratchet effect… Just look at the buying power of the dollar over time. It has never meaningfully retraced its losses post Bretton Woods (even the GFC was only a small blip). The trend is unmistakably a downward slope and it will continue that way.
Is this really how it works? Doesn’t CPI have to “catch up” to current rent levels, even if month over month price increases are 0% for the next 12 months?
JeffD,
You are correct, there will be a lag in CPI inflation, as leases expire and (grossly) inflated rents take their place.
Good observations.
“Short term, the sales-rate collapse for houses (both new and existing) constrains supply … that won’t reduce rents.””
It depends. If the housing supply is increasing and most are vacant, then an owner/seller has to either eat the monthly cost of a vacant house, or they can rent it increasing the rental supply.
“Longer term, sellers will have to drop prices unless rates come back down. A downward price trend motivates holders of 2nd homes to sell, so that will increase supply.”
How many houses are second/third homes that are not already rentals?
I think 2nd home owners own in resort areas so these areas may get some relief for long-term rentals. Unless the seller still sees a market for short term renting. It depends how many people are going wild with spending on postponed vacations.
More of the “it depends” stuff:
1) 9/10 of “new houses for sale” aren’t completed yet, and some aren’t even started (just permits). Without a buyer, they won’t get completed – so they won’t get rented either. Actual inventory of completed new homes is tiny (41K).
2) A fair number of people had a home in a place they didn’t want to live during COVID, so they leveraged their equity and insanely low rates and bought another home elsewhere. But instead of selling the first home, they hung onto it. The price was going up so fast that it paid them to own 2 houses and become investors. And maybe they wanted to return at some point “when the pandemic ends”. Official US stats on this seem to be stuck in the year 2018 so no help there.
3) I could see a lot of multiple-home-owners choosing not to take the risks of renting. Prices were going up so fast that renting wasn’t needed to make things pencil out. Renting is a hassle and may damage the property, so it’s also a risk. Finally, the government pretty much screwed all the landlords over with the pandemic eviction moratoria… logical unintended-consequences outcome being more people on the margin choosing not to rent, and
Rents should start to fall around March 2024.
Housing markets in west usually correct first then east coast then south then Midwest about a 2 year process
Wow, that’s quite a long span.
It takes that long for some people in the midwest to realize the west is affordable again and make the move. 😉
It also works the other way – prices in the boom-bust serial-bubble states shoot up first, causing people to flee the high cost of living, which pushes up prices everywhere else.
But only when the entire nation is overpriced does the political will show up for the Fed to start hitting the brakes.
It probably won’t take that long this time around, real estate data and dynamics permeate the populace in a way they have never done before.
(Fast reactions are the point of Wolf’s post…the Fed only started hiking 5 months ago and there has already been a huge collapse in demand).
A much higher percentage of owners thinking about selling, know exactly what interest rate hikes do to housing affordability/demand…especially at idiotically high “plague boom” prices.
From Wolf’s excellent Case-Schiller chart,
Housing prices
Peaked in 2007
Bottomed in 2012
Regained the 2007 value in 2017.
A 10 year cycle. The Mid-Westerners had about 5 years to notice that prices in the West were going down.
“Inventory for sale in all stages of construction jumped to 464,000 houses, up by 28%, from July last year, and the highest since March 2008”
How’s that possible with such a chronic shortage of labors?
Other way around: the huge boom in construction (demand) over the past two years CAUSED the labor shortage and the other shortages. As construction is now getting throttled back, the labor shortages loosen, and the spikes of materials prices abate.
Really great observation. Anyone who can swing a hammer or has minimum construction credentials are doing better than ever in my city.
There may be a building permit, but that doesn’t mean the house is anywhere near completion, or ever will be completed.
Locally there is several commercial projects that are advancing along at a snail’s pace. As threat of layoffs increases, progress will likely decrease even more. Even with all the projects in the works locally, several new ones are just beginning. They must expect the Fed and Government to continue to bail out EVERYONE. Well, there is always an election just around the corner!
Lots of single family homes under construction hidden away in the trees around here.
I suspect we will see a huge increase in homelessness, as rents and mortgages are too high for many. Just ask young folks, who aren’t living on student loans they expect to government to pay for.
When layoffs begin, hopefully not, then the number of homes on the market with skyrocket even more.
Home builders never seem to learn. How many homes will never be completed? Shades of Housing Bust 1.0.
The Rapids and Falls of the last chart look treacherous!
Once greed turns to fear noone will buy no matter how low the price.
That’s what you get from turning yoir housing market into a casino.
Sales are way down, but some people must still be buying. I wonder what generational cohort it is. Probably boomers — they got the money.
No one should be buying at these prices. But builders have lowered prices — they said so themselves to make deals, and they’re making some deals.
Millennials are now in their prime earnings years, and they’re making lots of money, and they’re running companies, and they’re cashing in on stock options, and they’re buying. GenXers are still buying too. But Boomers are largely done buying (not all but increasingly).
Plus Toll Brothers and Lennar are offering 3.99% on a 30 year fix.
If one was to buy a $550k home with 10% down, a 3.99% vs a 5.5% would knock off $500 off the monthly payment. From $2800 to $2300.
Lot of people go by monthly payments and not total long term cost. Thus the 3.99% might be pulling in some people too. Just guessing.
Toll’s orders in terms of number of houses plunged by 60% in the last quarter from the prior quarter. So they’re going to get creative without having to cut prices. But ultimately, they’ll have to cut prices. Subsidizing a mortgage might work too.
But but but I thought it was impossible we could have a repeat of 2007-2008 because there wasn’t enough supply. There Is A Shortage! And here we are with things looking 2007-2008-ish.
The other plank of the denialers is that this time it wasn’t the poors this time but well qualified buyers who would rather pay their mortgages than take less money.
Of course, if that was true than the stock market would never go down. It’s almost all owned be the wealthy. Instead, it is even more volatile.
What people forget is while a lot of folks during the last downturn could have kept their mortgages current, perhaps with a bit of sacrifice, but didn’t because they were underwater. In at least some states, the lender is limited to just the secured interest in foreclosure, not the entire mortgage balance. This creates an incentive for folks to trade their credit history to get out of bad debt. Add on top of it a real recession that everyone seems to be expecting, and history may rhyme a bit closer in time than they thought. Financially savvier people are more savvy.
When you have low activity, the transactions that do happen are the price. There are plenty of motivated sellers. Estates don’t want to hold houses indefinitely. Builders don’t want to hold houses indefinitely. People that need to move don’t want to hold houses indefinitely. People that didn’t buy during the bubble so only would lose paper profits that were never real.
@Nate: great reasoning, thanks!
I would also add multiple home owners to the category of those who don’t want to hold indefinitely
Not a repeat, but a Sequel.
Housing Bust 2.0, live-streaming soon to living rooms nationwide!
In the industry. Went through 08-10.
Rinse & repeat. The difference? The backlog of work.
NOT more work than 05-07….just fewer people to do the work.
Housing industry will certainly be in recession by fall.
The number crunchers can not even keep up.
Will it pull the Country into recession? No idea. I will leave that to Wolf.
We are in summer season now, and schools just opened up in Los Angeles, wondering what will happen in winter.
Been saying it for 2 years – this “correction” will be slow and minor IMHO – even in the West / SW. Winter slow sales season coming, wages / employment holding firm and interest rates still historically low and not likely to raise much more. 2008-2012 saw SFH median prices drop 35% (ish) and more like 45% (ish) in the West / SW. I’d bet we’ll see 1/2 of that (or less) within 2 years. Rents will climb steadily for the next 2 years.
Why do you think rents will climb?
They haven’t been in the SF Bay Area.
Probably because he has stated previously that he is a landlord. Same denial I see from many homeowners who don’t want to admit their housing equity is fake wealth.
As the motto of this forum states, “nothing goes to heck in a straight line”. Concurrently, if the 39-year bond bull market from 1981 ended as it appears to have decisively, (mortgage) interest rates are destined to ultimately blow past the 1981 peak since the actual fundamentals now versus then are absolutely awful.
With the amount of debt and leverage in the US economy and financial system, long-term trend in higher rates means that increasingly broke households will be less able to afford new mortgages as properties sell. Some here have claimed (or certainly implied) that most current homeowners will stay put but that’s not how life works. Many will have to sell due to life events, including higher unemployment which is coming later.
This isn’t the 1970’s when housing prices relative to household incomes were a lot more reasonable.
This is the second housing bubble this century (mania in some cities) and housing isn’t affordable to the “traditional” (as in pre-bubble) homebuyer, except with artificially low rates, very low credit standards, and inflated housing equity.
“housing equity is fake wealth”, thanks for the laugh.
Yep, gonna be lots of people getting reacquainted with the classic J.K. Galbraith concept of “bezzle” – the difference between what you think something is worth, and what it’s really worth. The perceived value gets inflated in bubbles based on fraud, deception or delusion, or what Wolf has called “consensual hallucination”. Then reality pops the fantasy and trillions of dollars in perceived wealth vanish, first gradually, then suddenly as a few people wake up and raise awareness, and then everyone wakes up with huge financial hangovers.
In the urban core near me, they are floating the idea to let home owners people build tiny homes in their back yard to rent out. That is their idea to combat lack of affordable housing near the downtown area.
Tony T and AF
I don’t have the bigger financial picture view like AF – and defer to AF’s recitations of other variables. I know RE, as AF states, as a landlord (17 years), then lender (past 5 years).
To answer your (Tony’s) Q? – I saw “non-leveraged” (no loans / pay cash for rental prop) rental returns of 10-17% net in the absolute best of times (homes bought 2008-2013). Prices have exploded since then and margins have disappeared. It’s been “bank on the equity appreciation” for 5-6 years now andvespecially since 2020.
Landlords who leverage-invested in the past 7-8 years got killer interest rates. Paying cash for a prop (like I used to do) pretty much died since 2016 or so.
Those leveraged investors are seeing inflation all over, from prop taxes to repairs and in some cases, their borrowing costs. Also,, renters are making more $$$.
Those landlords will see their equity squeezed as prices drop. Not saying they will panic, but if other economic factors remain strong (jobs, low rental inventory), landlords will keep prices moving up to shoot for cashflow because “banking on the equity” is no longer viable.
As for SF, there are many urban pockets across the USA that are going to act differently than the macro trend. SF is a beautiful city but it suffers trend shifting more than most cities.
Agreed. Whatever dip we experience will be papered over within a few years. We printed too much money, and the outcome is the simplest and most predictable of all concepts in economics: Create money out of thin air without commensurate value added to the economy, and prices will go up. We expanded our money supply by about 30% and median house price went up about 30%. In the 70s back when “it was different,” we roughly tripled the money supply and house prices roughly tripled. Easy. I can’t understand how anybody is able to talk themselves out of seeing that rock-solid connection. Or funnier still, that our Fed has somehow magically changed its stripes and will now valiantly do what is morally right… Crush the financial power brokers and come to the rescue of responsible savers whom it has forsaken for 4 decades. Sorry, that’s just not reality.
This isn’t the 70’s. Look at the ratio of home prices to incomes.
As for the FRB, key data point is FX value of the USD. It’s at DXY 108 giving them some room to “print” if they choose to follow the same insane path, but contrary to what practically everyone believes, the markets, economy, and public will be “thrown under the bus” to preserve the Empire which cannot survive in current form without USD as global reserve currency.
Believing elites (the ones actually in charge, not the mostly irrelevant majority of billionaires) will trade real world “hard power” for fake paper wealth is idiotic and it isn’t going to happen.
AF, I always agree with your sentiment that the average American is destined to become poorer, but I think we see two different paths to that eventuality. I see an eventual inflationary collapse of the dollar just like every other reserve currency before it. The Fed will never allow a deflationary collapse. DXY is just a measure against other also-inflating currencies. It doesn’t say much about the actual purchasing power of the dollar.
Look, most of the world does not get to have 4-person families in their own sprawling houses on a quarter or half acre each. A lot of the world lives in multigenerational households packed-in with aunts and uncles and in-laws at 10-15 or more people to a dwelling. That or small apartments. It’s totally possible that we’re entering a future where the average couple simply does not get to own a house by themselves. This is already becoming the case where I live in Southern CA. Try to find open street parking in my neighborhood… You can’t, because many houses on my block are now boomer homeowners with at least 1 gen-x or millenial kid + son/daughter in-law + grandchildren. That is how people afford to live here these days. At least 3-5 or more wage earners contributing to the mortgage or rent in single family homes. The majority of new construction around here is connected housing or apartments. I’ve heard the claim that CA always leads and other states follow… That might, unfortunately, be true in this case. Home ownership is not a right, and nobody said that the average couple HAS to be able to afford the average single family home in the average city. Alternatively, the 1990s saw median house price go pretty flat for 5 years while other stuff caught up a bit… That’s a possibility as well.
The DXY mainly reflects what is happening in Europe which is a basket case and getting worse.
The other main competent is the Yen which is now a victim of massive hedge fund speculation on hoping for its demise and fall.
Home prices to income is basically irrelevant for most real estate markets.
Maybe you could do some research and actually tell us why…..
Wishful thinking, perhaps. Inflation will not abate until assets are deflated. Interest rates will continue to rise until enough asset holders feel enough pain to unload at significantly lower prices. Asset deflation will trigger job losses. Maybe not great recession numbers, but a downward trend will begin. So much of the economy is psychological, and so many participants go which ever way the wind is blowing. Too many people still believe that assets will hold value. But not enough. Once the downward spiral begins (it has already) more and more will jump on the pessimist bus until the bottom is found. Just like every other economic cycle.
I wonder why house supply peaked at 12 months at the beginning of 2009 and dropped to 8 months during one of the worst stock crashes in 20 years. Were people buying during a market crash and financial crisis? Maybe many of the new homes for sale where going into foreclosure and taken off the market. It seems like the peak was at the beginning of a recession. I would have thought people would not have been buying houses in 2009, 2010, 2011 but months supply was dropping
Maybe it is in the way a months supply is calculated which I do not know. Inventory divided by average sales volume?
It was a very good time to invest in SFR’s. I was buying then. I’m a buyer anytime I can find a ‘good’ rental that meets my min ROI.
We bought a home in the Bay Area in 2010. The previous owners lost it to foreclosure because the sucked all the equity out of it, he lost his job, and the rest is history. We bought it from the bank after the multiple lenders fought over the crumbs. We paid cash. Did a cash out refi when our daughter mortgaged her portion after closing.
The house was over improved and I recall commenting to my daughter that we couldn’t duplicate it for what the asking price was. We bid $5K over asking, all cash, with only inspection contingencies.
I didn’t/don’t care what “the market” does because there is no “market”. It’s machine trading. Until the machine trading goes away (and it never will), these “markets” are nothing more than a bad joke. I recall standing in an airport (SLC, I think) and looking at the ticker on the TeeVee and commenting to a fellow traveler….. “Vegas meets Wall Street”. That was probably 18 years ago and nothing has changed.
I mentioned before about a local 55-lot DR Horton community where they are hurriedly building it all out with spec homes. 18 of the homes were posted on the MLS on 8/10, and all have been lowered by 4%-5% in price since then. Watching with fascination at the turnaround in the market.
If you go to the Tol Brothers website, they are offering a 3.99% 30 year fixed. They are probably not lowering the price much but instead paying down the interest rate?
They have access to money that most don’t. The other ploy is to play with the “options” by offering the $250 can lights at $100 each or offering enhanced interior trim, granite, or other high profit items. By not lowering the prices, they don’t risk inflaming their recent buyers who paid similar amounts for homes with less content as the “sale prices” do not appear to be falling off a cliff.
Empty houses don’t weather well. The equivalent of automotive “lot rot”.
PS: During that period (2010), the government was offering a $10,000 first time buyer incentive as a tax credit. That’s where we took the money from for the $5K over. She qualified as she had never previously owned a home.
1) New Single Families Houses Sold look like 1929 to 1936. The 1937 recession might be next.
2) The seventeen years of trading range to 1949 haven’t reached it’s half line.
3) The next high in 1946. at about 50% retracement followed the 1942 low.
4) If this analog correct, new home sales will breach the old peak
in mid 1955…26 years after 1929.
5) The best time to buy was mid 1949. The best years 1957/59 up in a straight line.
6) $2K for u $2K for me and student loans jubilee wouldn’t matter.
Better sell now if you need to sell. Prices are still high and rising in some markets, but the next step after inventory buildups is reduced prices.
I lowered prices on my new builds 6% and got half of them under contract within a week. The rest will be gone by the end of the month. Most other builders are still trying to hold out for early 2022 prices. Good luck.
With the exception of luxury homes, there will be very few new single family homes started with land prices high, building materials up 36+% from pre pandemic and anemic buyer traffic. It doesn’t bode well for buyers once the cycle turns up again.
To state the obvious, the economy has been punch drunk on cheap, easy capital (“Funny Money”) for years, well before the pandemic. This in turn has artificially impacted asset prices, especially RE. The only reason this has come to light is that the Fed has been forced to deal with high inflation which will tighten underwriting and strangle liquidity. The individual that will make it through this is one that is liquid, debt free (except perhaps on a primary residence), and well diversified.
“It doesn’t bode well for buyers once the cycle turns up again.”
If the interest rate cycle from 1981 turned in 2020, the cycle you reference won’t be at the same artificially low rates which existed for most of the period from 2002-2020. Incomes aren’t about to explode higher for most households to make up the difference either.
So, while it might not be good for buyers, it’s not likely to be good for sellers either.
The primary constant I expect to see is continued government mortgage guarantees. That won’t change any time soon. Depending upon the political environment, I can also see “housing affordability” tax credits which will (of course) make housing less affordable, except for those who get it.
By my reckoning, at still current artificially low mortgage rates, somewhat more than 20% of the population can “reasonably” afford the median priced home now. That’s without becoming a defacto debt serf and using any housing equity they have now plus any fake wealth from the asset mania in other asset markets.
Changes to the housing market happen at a slow pace. Buyers and sellers always look at the comps and it takes multiple rounds of changes in the comps to drive changes in prices.
I dont see inventory numbers for resale homes, I dont think the numbers are actually that high yet – this will take time and it will be very painful.
Sure the market has changed dramatically from a few months ago, but it is nowhere near affordable for most households in many areas, the West in particular. Markets like Boise ID and areas of Utah are still outrageously overpriced relative to incomes.
I applaud the buyers strike. That said, 107K of that housing “supply” hasn’t even started construction, and only 45K completed new homes are out there as of this report, pretty much the same as last month. Completed inventory is still at historic lows. Until that changes prices are going to move sideways, regardless of sales.
JeffD,
1. Completed inventory WAS at historic lows and has been rising for months as under-construction inventory becomes completed inventory and is still not sold.
2. When completed inventory gets too big, it will kill the homebuilders, as it did last time.
Completed inventory = spec homes: that’s where the risks are.
The second layer of risks are with under-construction homes.
Homebuilders have GOT to sell those, or else.
Both of them have absorbed a huge amount of cash, and have large carrying costs, and if they cannot be sold pronto, the homebuilder topples.
I’m a San Diego resident that observes the market here quite closely & I like that Wolf references San Diego in most of his housing articles. For good reasons – we have holy-moly prices down here & given the holy-moly current borrowing costs, it’s unattainable for affluent families, not to mention the lower income families. Something has to give. The inventory has not crept up that much, but you can tell sellers are slashing prices because, as Wolf says, “buyers are a lot lower.” It will be interesting to see when we hit the other end of the bell curve and reach 2020 prices. If we ever do. I think we’ll have a clearer picture by the end of the year, as we all know real estate has a lag factor.
Cheers – keep up the good work of reporting.
Hi Wolf;
Why is it that the ETF XHB remains so persistently high? Granted that the security has had a June/July wobble, but it is higher now than it was at the beginning of April. I would think that with all the latest data, it would be going downward rather than up/sideways.
Thanks!
XHB is down 25% YTD, despite the huge summer rally that is now over.
You’re welcome.
It’s finally here!!
I feel like I’m 7-years old and it’s my birthday.
“ Sales of New Houses Collapse (in the West by 50%!) Inventories & Supply Spike to High Heaven, Worst since Peak of Housing Bust 1”
Not sure I can read the rest of the article cause of the grin on my face getting in the way.
is this schadenfreude or are you looking to buy?
I am looking for a home in the Northeast. One appeared on Zillow last week with an asking price identical to its assessed value. It’s already off the market, under contract.
Meanwhile, dozens of other homes have been available for a month or more. They have asking prices 100-150% above assessed value.
House prices to incomes comparing today to yesteryear, are apples and oranges. When buyer’s incomes are shunted to energy and food, and soon to higher taxes, the income available for housing ‘improvements’ shrinks.
Currently at 8.3 to one, it is at all time record high. Post this against a shrinking budget do to rampant inflation and you get not a buyer’s market nor a seller’s market, but a dead market.
Oh sure the higher incomers are OK but that isn’t the biggest part of housing.
Been watching development and factory production of Incredible Tiny Homes 8 x 16 home. He has got a design he sells for $19,500 and has gotten labor down to 80 man – hours. That works out to about $2400 labor cost per home.
He just hit production rate of five per day.
If you don’t want a $500,000 mortgage then you have to think outside the box.
It’s very inefficient to build a traditional stick and brick. Around 4000 man hours I think.
Wolf, looking for your opinion. I had a friend who mentioned something eye opening that I hadn’t heard before regarding the last financial crash and why it can happen again. He said home prices are up 2-3x from where prices were in 2007 and that 1 home in default today (peak) equals 3 back then.
What do you think?
What were the prices in 2007 verses pre-2007?
DarkMatter,
You just need to look at the mortgage balances. That’s where it’s at:
https://wolfstreet.com/2022/08/04/trip-back-to-reality-starts-mortgages-helocs-balances-delinquencies-foreclosures-in-q2/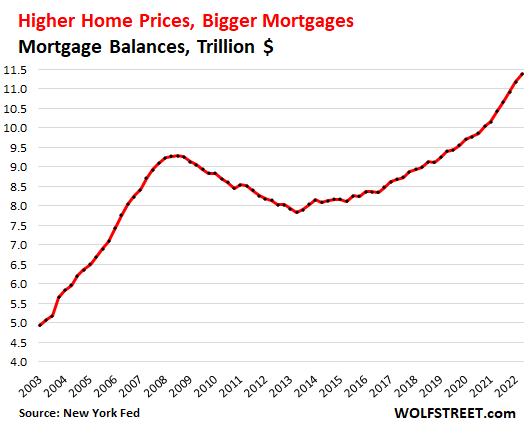
But defaults are historically low for now: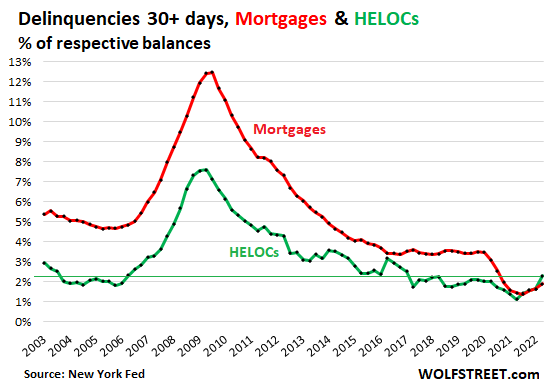
There is a certain delusion and denial in a bubble or they wouldn’t form. We will all probably be cursing modern central bankers when they land this plane.
I came across another fintech that probably has been helping juice the all cash buyers market.
It is called zerodown. They buy the home for you with all cash and then you rent to own it from them and eventualy buy it. Thus this lets you outbid people and you can get into a home with zerodown.
What a great time to be buying a house. LOL All kinds of ways to get into a house without the historical 20% down of the pre 1980s.
lol, I put 20% down in 2018.
The charts that Wolf has included suggest that there is a few more months left before peak new single house or new house supply is reached at 12 months of sales from the present 11 months of sales
This makes sense when considers more FED rate rises to come
Jan 2023 looks like time for the Supply charts to start their 5 year nosedive once again
Current lenders must be worried
Housing inventory measured in months of sales is not the same as the number of unsold homes listed for sale. According to a FRED housing chart, the number of U.S. active listings in July 2022 was close to 800,000 homes. In 2016 the number of active listings was close to 1,500,000.
The U.S. population grew by 22 million 2010-2020. Over 2,000,000 people were added each year. The southern border has seen increased immigration this year.
David Hall,
In terms of your first paragraph: RTGDFA
This article is about NEW houses, offered for sale by homebuilders. And I gave you the number of NEW HOUSES for sale (464,000), and I gave you the chart of new houses for sale. So RTGDFA BEFORE you post this BS.
You’re citing existing homes inventory — houses, condos, and townhouses, listed by current owner. I reported existing home sales and inventories, etc. last week:
https://wolfstreet.com/2022/08/18/housing-recession-sales-plunge-to-lockdown-levels-active-listings-surge-prices-begin-to-dip-price-reductions-spike-investors-pull-back/
These are the “active listings” (inventory for sale minus pending) of existing homes, which I reported last week, and which is what you’re referring to: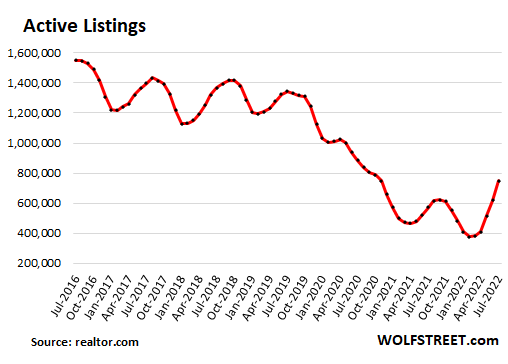
Long time reader. Finally understood what RTGDFA means…..and I can’t stop laughing.
The expression was coined by a commenter a few months ago. The world hasn’t been the same since :-]
The inflation is at 8% plus. Fed still has to tight a lot and hike rates. The show has not yet begun properly. I wonder how things would look after 6 months.
I wonder how the Chinese property crisis will impact us on the West coast?
First of all thank you Wolf for providing this information, so helpful in analyzing the state of housing. I looked at your “Median Price, New Single-Family Houses Sold” chart and saw the price bounce higher in July and thought, how did that happen when pretty much every other chart you have would lead me to think price should not have bounced to the upside? There is one chart that may help explain this and its the 30 year fixed rate mortgage chart (https://fred.stlouisfed.org/series/MORTGAGE30US). If you look at this chart, since the peak of 5.81% around June 23, mortgage rates have been trending lower to a 5.13% around August 18th (the most recent data point available on the chart). My take on all this is that housing demand is there waiting to pounce, but since it’s extremely rate sensitive this will not occur as long as the FED continues to battle inflation and puts pressure on mortgage rates to remain elevated. As pressure eases and mortgage rates trend downward, expect to see further upside to the median price charts.
In terms of your connection to July median price and July mortgage rates — You got this wrong. The median price ALWAYS bounces UP and DOWN. Look at the chart. It’s very volatile, always, everywhere. You don’t get a trend from one month. You need to have several months to get the first indication of a trend.
The three-month moving average is a better indicator of a trend (below the basic median price chart).
That’s why the median price is not a good measure, and I prefer the Case-Shiller but there is no Case-Shiller for new houses, and the CS lags 4-6 months, and that’s not great either when the market turns. So median price is what we have to use.
Average 30-year fixed fluctuates from day to day. Today, it’s back at 5.73%. These day-to-day fluctuations have no impact on home prices. You need bigger trends to impact home prices, and the bigger trend is 5%+ mortgage rates, instead of 3%.
Wow, five days later and mortgage rates jumped from 5.13% to 5.73%, talk about volatility! I see the fluctuations and I agree, it is very difficult if not impossible to identify a trend so quickly, but looking at it since the runup starting in 2020, the clearest trend downwards was May and June of this year, and I would have expected July to follow that trend, especially considering that most if not all of your other charts continued their trends. So other than identifying a trend, I looked at this as a possible indication of how rate sensitive housing demand is at the moment. So the next question is why? I think home prices are at or near a ceiling at these mortgage rates, and if you want to know where housing prices will go next, look closely at mortgage rates.
Slower in Seattle but not seeing prices drop, and houses are still selling, especially in Wokeville, USA Capitol Hill Seattle. Those libs are still roaring bulls.
So would it be fair to say that during the 2007 crisis, the market crashed because people could not pay their predatory loans, whereas this year, people for the most part can pay their ridiculously large loan (or are too flush with money to have one), but are now simultaneously running to the door as interest rates rise to cash out on their golden egg? Who knows how deep prices can fall in the race, in California houses can loose several hundred thousand $ (or a few million $) in value in a few months, MLS comps are going to spread the hurt. Welcome to early retirement for the lucky ones, or home slavery for bag holders.
I think you have a good point comparing 2007 to today – they can pay their ridiculous loan because they still have a job and got the loan at a 2.5% to 3.5% mortgage rate. I don’t think they are running to the door – inventory is increasing because there is not enough demand to buy houses at current prices because fewer people can afford a ridiculous loan at a 5.73% mortgage rate.
Peak buyers (spring ’22) in my SoCal zip code have lost at least 10% and in a few cases 20% of equity. Factoring in the higher interest rates, monthly costs are not down of course, but the fact that homes are losing noticeable value and trending down is a great sign. Long way to go but it’s early.
It’s going to be awesome watching this slow march downhill.
I’m watching an neighbors house what it finally sells for..
5,500 sqft, had to list it down to 1.45M, 78 days on the market had to mark it down from 1.79M, he picked it up for 1.2M in 2020. If he would have sold it in Late 2021 or real early 2022 he most likely would have got 2M+ with 10+ bidders thinking they are getting a bargain.
This was in Evergreen, CO.
Reading comments I get the strange feeling that Kunal is posting with multiple handles.
No there is only one Kunal and Wolf deletes his comments because Wolf does not like his opinions that contradicts him.
Silence those who disagree and preach liberty and free speech to everyone else.
There is only one Kunal, and Kunal is a troll that spreads BS. Kunal likely belongs to the army of trolls that is paid to spread BS. And Wolf tolerated that BS for too long, but apparently no longer does, according to people familiar with the matter.
Race to the bottom? Deflating existing home prices denominated in rapidly depreciating dollars. Inflation adjusted charts may be in order.
Here in Brisbane, Australia rising construction costs appear to be wreaking havoc on builders. I was walking my dogs this morning through the new development close to us, and happened upon a couple whose home construction seems to have hit a standstill, I chatted with them and it seems nothing has happened at the site since early June, the builder apparently wants them to approve a variation for $80 000 AUD, but they are rather trying to opt out of the contract. It appears that they will be the proud owners of a new concrete slab with a steel frame on it for some time to come.
Your email address will not be published.
Meme-stock crowd got crushed, shares collapsed 69% in 4 days. Billionaire hedge-fund hero, who might have known about unpaid bills, got out in time.
Not all commodities are plunging: Game of Inflation Whac A Mole.
Overall supply at retailers still 18% below normal, huge shortages in some segments, gluts in others. Thankfully, grocery stores only a tad below normal.
San Francisco & Silicon Valley lead. Southern California catching up. In Los Angeles, prices fell in July from June for the first since Adam and Eve.
Buyers moseyed away from sky-high prices but are still there, just a lot lower, while many sellers hang on to illusions.
Copyright © 2011 – 2022 Wolf Street Corp. All Rights Reserved. See our Privacy Policy
Powerful Wealth Building Resources

