

Pgiam/iStock via Getty Images
Pgiam/iStock via Getty Images
Actions of institutional investment organizations in managing their multi-billion-dollar stock portfolios require the negotiating help, and often temporary liquid capital assist, of Market-Makers [MMs] in the prompt, low-disturbance round-up of desired shares of identified promising companies.
MM risk-avoidance requirements continually drive derivative market prices, revealing in the limited-life legal contracts traded there the underlier stocks’ price-range extremes regarded likely by the well-informed sellers and buyers of the related risk protections. They are informed by over 100,000 world-wide wide-eyed and keen-eared MM employees on a 24x7x365 watch for change in competitive circumstances. Changes which get immediately communicated to the home-base trading desks.
Following an unchanging risk-minimizing portfolio management discipline, we keep records on how insightful the maintained intelligences flow has been on each of thousands of subject stocks over decades of daily observations. Those records provide the basis for making intelligent transactions about likely coming prices of specific securities, near-term.
Among the best potentials for price increases at this point in time is AES Corporation (NYSE:AES).
“The AES Corporation operates as a diversified power generation and utility company. It owns and/or operates power plants to generate and sell power to customers, such as utilities, industrial users, and other intermediaries. The company also owns and/or operates utilities to generate or purchase, distribute, transmit, and sell electricity to end-user customers in the residential, commercial, industrial, and governmental sectors; and generates and sells electricity on the wholesale market. It uses a range of fuels and technologies to generate electricity, including coal, gas, hydro, wind, solar, and biomass; and renewables, such as energy storage and landfill gas. The company owns and/or operates a generation portfolio of approximately 31,459 megawatts. It has operations in the United States, Puerto Rico, El Salvador, Chile, Colombia, Argentina, Brazil, Mexico, Central America, the Caribbean, Europe, and Asia. The company was formerly known as Applied Energy Services, Inc. and changed its name to The AES Corporation in April 2000. The AES Corporation was incorporated in 1981 and is headquartered in Arlington, Virginia.”
Source: Yahoo Finance
Yahoo Finance
Yahoo Finance
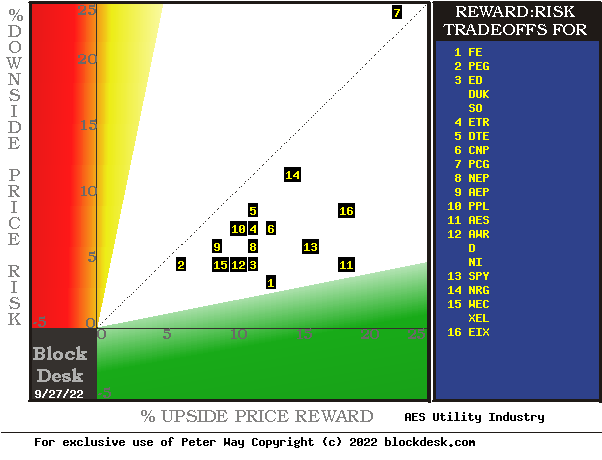
The big picture: Risks vs. Rewards
Investment portfolio candidate competitors to AES include many companies in the Electric Utilities industry.
Figure 1
blockdesk.com
blockdesk.com
(used with permission)
The tradeoffs here are between near-term upside price gains (green horizontal scale) seen worth protecting against by Market-makers with short positions in each of the stocks, and the prior actual price drawdowns experienced during holdings of those stocks (red vertical scale). Both scales are of percent change from zero to 25%.
The intersection of those coordinates by the numbered positions are identified by the stock symbols in the blue field to the right.
The dotted diagonal line marks the points of equal upside price change forecasts derived from Market-Maker [MM] hedging actions, and the actual worst-case price drawdowns from positions that could have been taken following prior MM forecasts like today’s.
This map of price change potentials places better-tradeoff candidates in the directions of down and to the right. The “frontier” of currently most-capable stocks for near-term gains begins with FE at [1], continues with a “market index” norm of the S&P 500 index ETF (SPY) at [13] and runs to EIX at [16]. It is superseded by our principal interest in AES at [11].
Those forecasts are implied by the self-protective behaviors of MMs who must usually put firm capital at temporary risk to balance buyer and seller interests in helping big-money portfolio managers make volume adjustments to multi-billion-dollar portfolios. Their protective actions define daily the extent of likely expected price changes for thousands of stocks and ETFs.
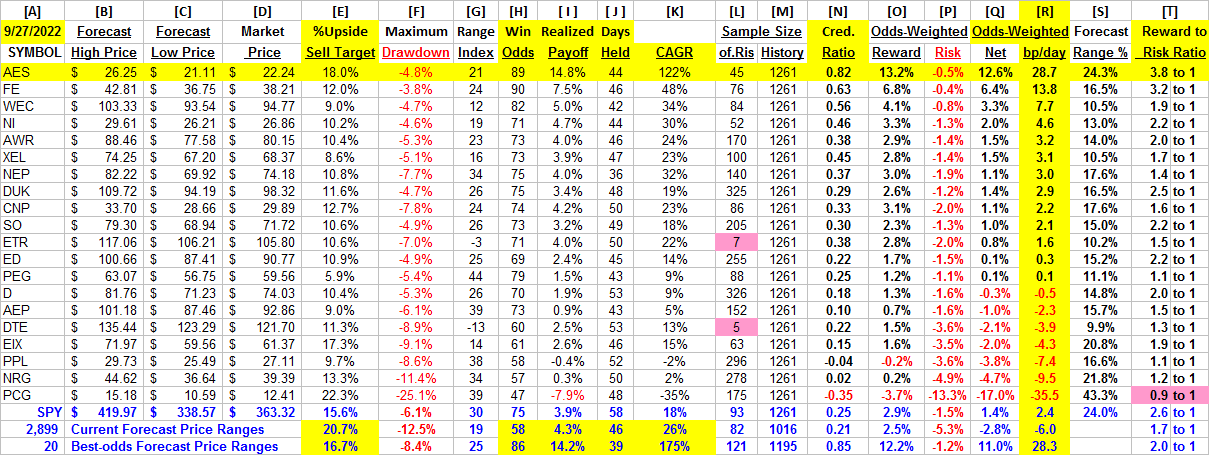
This map is a good starting point, but it can only cover some of the investment characteristics that often should influence an investor’s choice of where to put his/her capital to work. The table in Figure 2 covers the above considerations and several others.
Figure 2
blockdesk.com
blockdesk.com
(used with permission)
The price-range forecast limits of columns [B] and [C] get defined by MM hedging actions to protect firm capital required to be put at risk of price changes from volume trade orders placed by big-$ “institutional” clients.
We then use market actions subsequent to the prior appearances of up-to-down balance prospects like those of this day.
[E] measures potential upside risks for MM short positions created to fill such orders, and reward potentials for the buy-side positions so created. The buy-side risks actually encountered from prior forecasts like the present are in [F], as the most severe loss moments encountered during holding periods in effort to reach [E] gains. Those are where buyers are most likely to accept losses.
[H] tells what proportion of the [L] sample of prior like forecasts have earned gains by either having price reach its [B] target, or be above its [D] entry cost at the end of a 3-month max-patience holding period limit. [ I ] gives the net gains-losses of those [L] experiences and [N] suggests how credible [E] may be compared to [ I ].
Further Reward~Risk tradeoffs involve using the [H] odds for gains, with the 100 – H odds as loss weights for N-conditioned [E] and for [F], for a combined-return score [Q]. By using the typical position holding period [J] on [Q] we have a figure of merit [fom] ranking measure [R] useful in portfolio position preferencing. Figure 2 is row-ranked on R among candidate securities, with AES in top rank.
No other alternatives than AES have better raw Reward to Risk ratios (3.8 to 1) nor have stronger odds-weighted current stock price expectations. That is further evidenced in Compound Annual Growth Rates [K] of 121% for AES.
On the same standards of comparison the only one of the alternative stocks approaching the fom [R] of AES at 28 basis points per day is FE with an average gain of 13.8 bp/day.
Among the 20 best-ranked of all 2,899 of today’s MM price-range forecasts, their higher realized payoffs (14.2%), Win Odds (86 of 100) and holding periods (39 days) boost their average CAGRs to 175%.
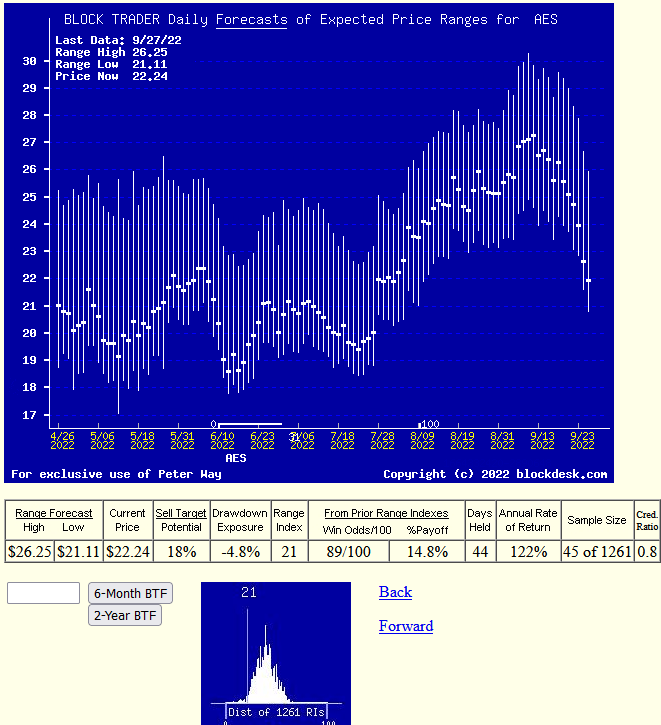
The current week’s combined easing in market quotes and modes expansion of coming-price expectations provide AES with improved competitive investment comparisons to alternatives. Figure 3, unlike “technical analysis charts” shows daily forecasts of coming likely price ranges, rather than past actual days’ prices.
Those forecast price ranges are split into upside and downside prospects by the issue’s closing price of the current-day forecast. The Range Index tells what percentage of that range lies below the current market price. This clear definition of expected price risk in relation to prospective upside price for all stocks makes comparisons between alternative portfolio candidates much easier to evaluate than most nebulous references to “risk” when what may be referred to is merely poorly-defined “uncertainty” of the future.
Figure 3
blockdesk.com
blockdesk.com
(used with permission)
The “thumbnail” lower picture in Figure 3 shows the distribution of the past 5 years of daily MM forecasts in terms of the market’s then current price quote for AES relative to its upper and lower limits. The current Range Index of 21 indicates that only 21% of the full forecast range is to the downside, while the remaining 79% is to the upside, almost 4 times that to the downside.
The frequency of the past 5 years’ daily Range Index value provides a clear visual idea of the dominant odds for higher coming prices in coming weeks and months.
AES Corporation, as seen by the market-making community, appears to be a currently most attractive electric utility industry stock for near-term capital gain among many leading competitors.
This article was written by
Disclosure: I/we have no stock, option or similar derivative position in any of the companies mentioned, but may initiate a beneficial Long position through a purchase of the stock, or the purchase of call options or similar derivatives in AES over the next 72 hours. I wrote this article myself, and it expresses my own opinions. I am not receiving compensation for it (other than from Seeking Alpha). I have no business relationship with any company whose stock is mentioned in this article.
Additional disclosure: Additional disclosure: Peter Way and generations of the Way Family are long-term providers of perspective information, earlier helping professional investors and now individual investors, discriminate between wealth-building opportunities in individual stocks and ETFs. We do not manage money for others outside of the family but do provide pro bono consulting for a limited number of not-for-profit organizations.
We firmly believe investors need to maintain skin in their game by actively initiating commitment choices of capital and time investments in their personal portfolios. So our information presents for D-I-Y investor guidance what the arguably best-informed professional investors are thinking. Their insights, revealed through their own self-protective hedging actions, tell what they believe is most likely to happen to the prices of specific issues in coming weeks and months. Evidences of how such prior forecasts have worked out are routinely provided, both on blockdesk.com and on our Seeking Alpha Contributor website.

