

Pgiam/iStock via Getty Images
Pgiam/iStock via Getty Images
21st Century paces of change in technology and rational behavior (not of emotional reactions) seriously disrupts the commonly accepted productive investment strategy of the 20th century.
One required change is the shortening of forecast horizons, with a shift from the multi-year passive approach of buy&hold to the active strategy of specific price-change target achievement or time-limit actions, with reinvestment set to new nearer-term targets.
That change avoids the irretrievable loss of invested time spent destructively by failure to recognize shifting evolutions like the cases of IBM (IBM), Kodak (KODK), GM (GM), Xerox (XRX), GE (GE) and many earlier others.
It recognizes the progress in medical, communication and information technologies and enjoys their operational benefits already present in extended lifetimes, trade-commission-free investments, and coming benefits in transportation utilizations and energy usage.
But it requires the ability to make valid direct comparisons of value between investment reward prospects and risk exposures in the uncertain future. Since uncertainty expands as the future dimension increases, shorter forecast horizons are a means of improving the reward-to-risk comparison.
That shortening is now best attended at the investment entry point by knowing Market-Maker expectations for coming prices. When reached, their updates are then reintroduced at the exit/reinvestment point and the term of expectations for the required coming comparisons are recognized as the decision entry point to move forward.
The MM’s constant presence, extensive global communications and human resources dedicated to monitoring industry-focused competitive evolution sharpens MM price expectations, essential to their risk-avoidance roles.
Their roles require firm capital be only temporarily risk-exposed, so they get hedged by derivative-securities deals to avoid undesired price changes. The deals’ prices and contracts provide a window to MM price expectations.
Information technology via the internet makes investment monitoring and management time and attention efficient despite its increase in frequency.
Once an investment choice is made and buy transaction confirmation is received, a target-price GTC sell order for the confirmed number of shares at the target price or better should be placed to ensure realization. Keeping trade actions entered through the internet on your lap/desk-top or cell phone should avoid trade commission charges. Your broker’s internal system should keep you informed of your account’s progress.
Your own private calendar record should be kept noting the date 63 market days (or 91 calendar days) beyond the trade’s confirmation date as a time-limit alert to check if the GTC order has not been executed. If not, then start your decision process of exit and reinvestment.
The 3-months time limit is what we find to be a good choice, but may be extended a month at a time if desired. Beyond 5-6 months further investments of time start to work against the process and are not recommended.
For investments guided by this article or by others target sell prices will always be found here as the high price in the MM forecast range.
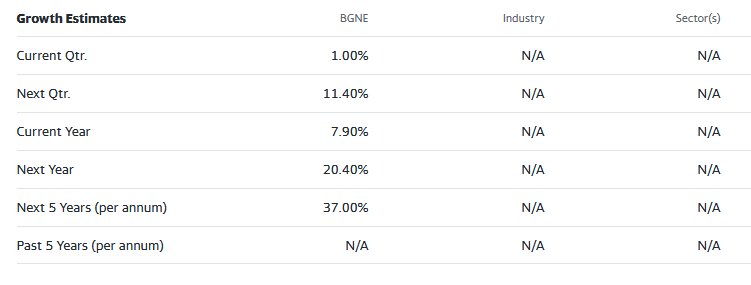
“BeiGene, Ltd., a biotechnology company, focuses on discovering, developing, manufacturing, and commercializing various medicines worldwide. Its products include ones to treat relapsed/refractory (R/R) mantle cell lymphoma; to treat R/R classical Hodgkin’s lymphoma; and other cancers, and leukemia. The company has strategic collaborations with Shoreline Biosciences, Inc., Amgen Inc., Novartis AG, and Bristol Myers Squibb company. BeiGene, Ltd. was incorporated in 2010 and is headquartered in Cambridge, Massachusetts..”
Source: Yahoo Finance
Yahoo Finance
Yahoo Finance
These growth estimates have been made by and are collected from Wall Street analysts to suggest what conventional methodology currently produces. The typical variations across forecast horizons of different time periods illustrate the difficulty of making value comparisons when the forecast horizon is not clearly defined.
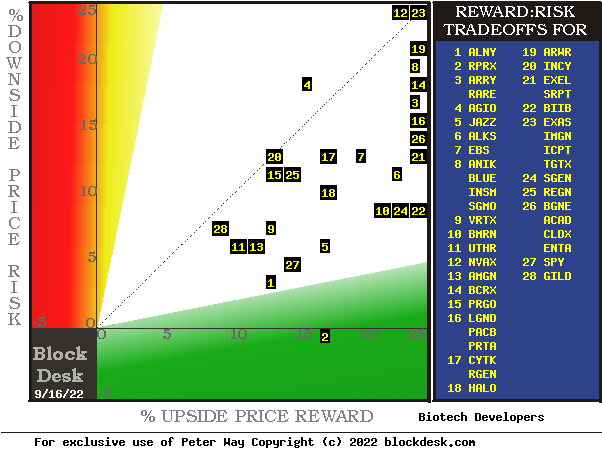
Figure 1
blockdesk.com
blockdesk.com
used with permission
The risk dimension is of actual price drawdowns at their most extreme point while being held in previous pursuit of upside rewards similar to the ones currently being seen. They are measured on the red vertical scale. Reward expectations are measured on the green horizontal scale.
Both scales are of percent change from zero to 25%. Any stock or ETF whose present risk exposure exceeds its reward prospect will be above the dotted diagonal line. Capital-gain-attractive to-buy issues are in the directions down and to the right.
Our principal interest is in BGNE at location [26], close to the right edge of the green horizontal reward scale, and halfway up on the risk scale. A “market index” norm of reward~risk tradeoffs is offered by SPY at [27]. Most appealing by this Figure 1 view for wealth-building investors may appear to be BIIB at [22], but comparative details in Figure 2 will elaborate.
The Figure 1 map provides a good visual comparison of the two most important aspects of every equity investment in the short term. There are other aspects of comparison which this map sometimes does not communicate well, particularly when general market perspectives like those of SPY are involved. Where questions of “how likely’ are present other comparative tables, like Figure 2, may be useful.
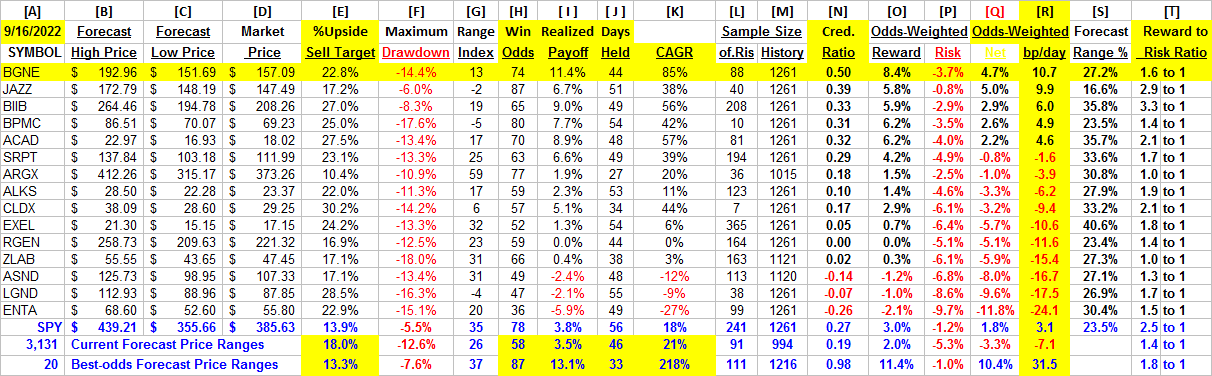
Yellow highlighting of the table’s cells emphasize factors important to securities valuations and the security BGNE of most promising of near capital gain as ranked in column [R].
Figure 2
blockdesk.com
blockdesk.com
(used with permission)
Figure 2’s purpose is to attempt universally comparable answers, stock by stock, of a) How BIG the prospective price gain payoff may be, b) how LIKELY the payoff will be a profitable experience, c) how SOON it may happen, and d) what price drawdown RISK may be encountered during its active holding period.
Readers familiar with our analysis methods after quick examination of Figure 2 may wish to skip to the next section viewing price range forecast trends for BGNE.
Column headers for Figure 2 define investment-choice preference elements for each row stock whose symbol appears at the left in column [A]. The elements are derived or calculated separately for each stock, based on the specifics of its situation and current-day MM price-range forecasts. Data in red numerals are negative, usually undesirable to “long” holding positions. Table cells with yellow fills are of data for the stocks of principal interest and of all issues at the ranking column, [R].
The price-range forecast limits of columns [B] and [C] get defined by MM hedging actions to protect firm capital required to be put at risk of price changes from volume trade orders placed by big-$ “institutional” clients.
[E] measures potential upside risks for MM short positions created to fill such orders, and reward potentials for the buy-side positions so created. Prior forecasts like the present provide a history of relevant price draw-down risks for buyers. The most severe ones actually encountered are in [F], during holding periods in effort to reach [E] gains. Those are where buyers are emotionally most likely to accept losses.
The Range Index [G] tells where today’s price lies relative to the MM community’s forecast of upper and lower limits of coming prices. Its numeric is the percentage proportion of the full low to high forecast seen below the current market price.
[H] tells what proportion of the [L] sample of prior like-balance forecasts have earned gains by either having price reach its [B] target or be above its [D] entry cost at the end of a 3-month max-patience holding period limit. [ I ] gives the net gains-losses of those [L] experiences.
What makes BGNE most attractive in the group at this point in time is its ability to produce capital gains most consistently at its present operating balance between share price risk and reward at the Range Index [G]. At a RI of 13, today’s price is above the bottom of its forecast range, with price expectations to the upside seven times those to the least-likely. Not our expectations, but those of Market-Makers acting in support of Institutional Investment organization clients building the values of their typical multi-billion-$ portfolios.
Credibility of the [E] upside prospect as evidenced in the [I] payoff at +11% is shown in [N].
Further Reward~Risk tradeoffs involve using the [H] odds for gains with the 100 – H loss odds as weights for N-conditioned [E] and for [F], for a combined-return score [Q]. The typical position holding period [J] on [Q] provides a figure of merit [fom] ranking measure [R] useful in portfolio position preferencing. Figure 2 is row-ranked on [R] among alternative candidate securities, with BGNE in top rank.
Along with the candidate-specific stocks these selection considerations are provided for the averages of some 3,300 stocks for which MM price-range forecasts are available today, and 20 of the best-ranked (by fom) of those forecasts, as well as the forecast for S&P 500 Index ETF as an equity-market proxy.
Current-market index SPY is only moderately competitive as an investment alternative. Its Range Index of 35 indicates two-thirds of its forecast range is to the upside, while about three quarters of previous SPY forecasts at this range index produced profitable outcomes.
As shown in column [T] of figure 2, the levels vary significantly between stocks. What matters is the net gain between investment gains and losses actually achieved following the forecasts, shown in column [I]. The Win Odds of [H] tells what proportion of the Sample RIs of each stock were profitable. Odds below 80% often have proven to lack reliability.
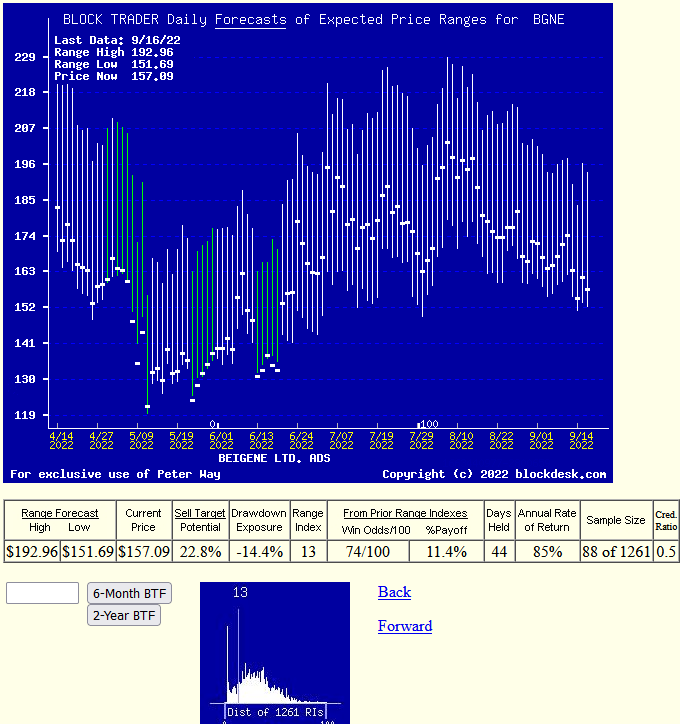
Figure 3
blockdesk.com
blockdesk.com
(used with permission)
Many investors confuse any time-repeating picture of stock prices with typical “technical analysis charts” of past stock price history. These are quite different in their content. Instead, here Figure 3’s vertical lines are a daily-updated visual record of price range forecast limits expected in the coming few weeks and months. The heavy dot in each vertical is the stock’s closing price on the day the forecast was made.
That market price point makes an explicit definition of the price reward and risk exposure, expectations which were held by market participants at the time. This is a visual display of their vertical balance between risk and reward.
The measure of that balance is the Range Index (RI).
With today’s RI of 13 BGNE has 22.8% upside price change in prospect. Of the prior 88 forecasts like today’s RI, 65 have been profitable. The market’s actions of prior forecasts became accomplishments of +11% gains in 44 market days., or 9 weeks. So history’s advantage could be repeated five times or more in a 252 market-day year, which compounds into a CAGR of +85%.
Also please note the smaller low picture in Figure 3. It shows the past 5 year distribution of Range Indexes with the current level visually marked. For BGNE the largest proportion of recent past forecasts have been of higher prices and Range Indexes.
Based on direct comparisons with BGNE and other Biotech Developer participants, there are strong wealth-building reasons to prefer a capital-gain seeking buy in BeiGene, Ltd. (NASDAQ:BGNE) over other examined alternatives
This article was written by
Disclosure: I/we have no stock, option or similar derivative position in any of the companies mentioned, but may initiate a beneficial Long position through a purchase of the stock, or the purchase of call options or similar derivatives in BGNE over the next 72 hours. I wrote this article myself, and it expresses my own opinions. I am not receiving compensation for it (other than from Seeking Alpha). I have no business relationship with any company whose stock is mentioned in this article.
Additional disclosure: Additional disclosure: Peter Way and generations of the Way Family are long-term providers of perspective information, earlier helping professional investors and now individual investors, discriminate between wealth-building opportunities in individual stocks and ETFs. We do not manage money for others outside of the family but do provide pro bono consulting for a limited number of not-for-profit organizations.
We firmly believe investors need to maintain skin in their game by actively initiating commitment choices of capital and time investments in their personal portfolios. So our information presents for D-I-Y investor guidance what the arguably best-informed professional investors are thinking. Their insights, revealed through their own self-protective hedging actions, tell what they believe is most likely to happen to the prices of specific issues in coming weeks and months. Evidences of how such prior forecasts have worked out are routinely provided, both on blockdesk.com and on our Seeking Alpha Contributor website. . Pls see SA articles numbered 1495621 and 1936131.


