

PM Images
PM Images
Recently, I keep finding myself concerned about the volatile market environment and looking for ways to protect my portfolio. That is why I keep going through high distribution yielding funds and investments: a bird in hand is better than two in the bush.
The fund I am reviewing in this article is the SPDR Portfolio S&P 500 High Dividend ETF (NYSEARCA:SPYD). I will also compare it to my current yield champion, the Schwab U.S. Dividend Equity ETF (SCHD).
SPYD has a high current yield of 3.9% and has outperformed YTD. However, in my opinion, I still prefer SCHD as my income pick because SCHD’s investment strategy weighs financial strength along with dividend yield and dividend growth. SPYD has large sector weights in cyclical financials and energy companies that may cause a steep drawdown if the economy goes into a recession.
The SPDR Portfolio S&P 500 High Dividend ETF is a $7.8 billion ETF that seeks to provide high dividend income and the opportunity for capital appreciation.
SPYD’s strategy is to provide investment returns comparable to the S&P 500 High Dividend Index (“Index”). The Index measures the performance of 80 high dividend-yielding companies within the S&P 500. Dividend yield is defined as the latest annualized base dividend yield, which excludes special dividends. The Index is equally weighted and rebalanced semi-annually. As of July 31st, the index only has 77 constituents.
As the fund and its corresponding Index invests in the highest yielding companies within the S&P 500, it is more heavily weighted towards defensive sectors like Utilities and REITs, as well as Financials and Energy companies (Figure 1). For example, the Fund and the Index have a 21.4% weight in Financials, roughly double the 10.6% weight in the S&P 500. Utilities are at a 16.3% weight vs. 3.0% in the S&P 500. Real Estate has a 14.6% weight vs. 2.9% and Energy has a 9.2% weight vs. 4.3%.
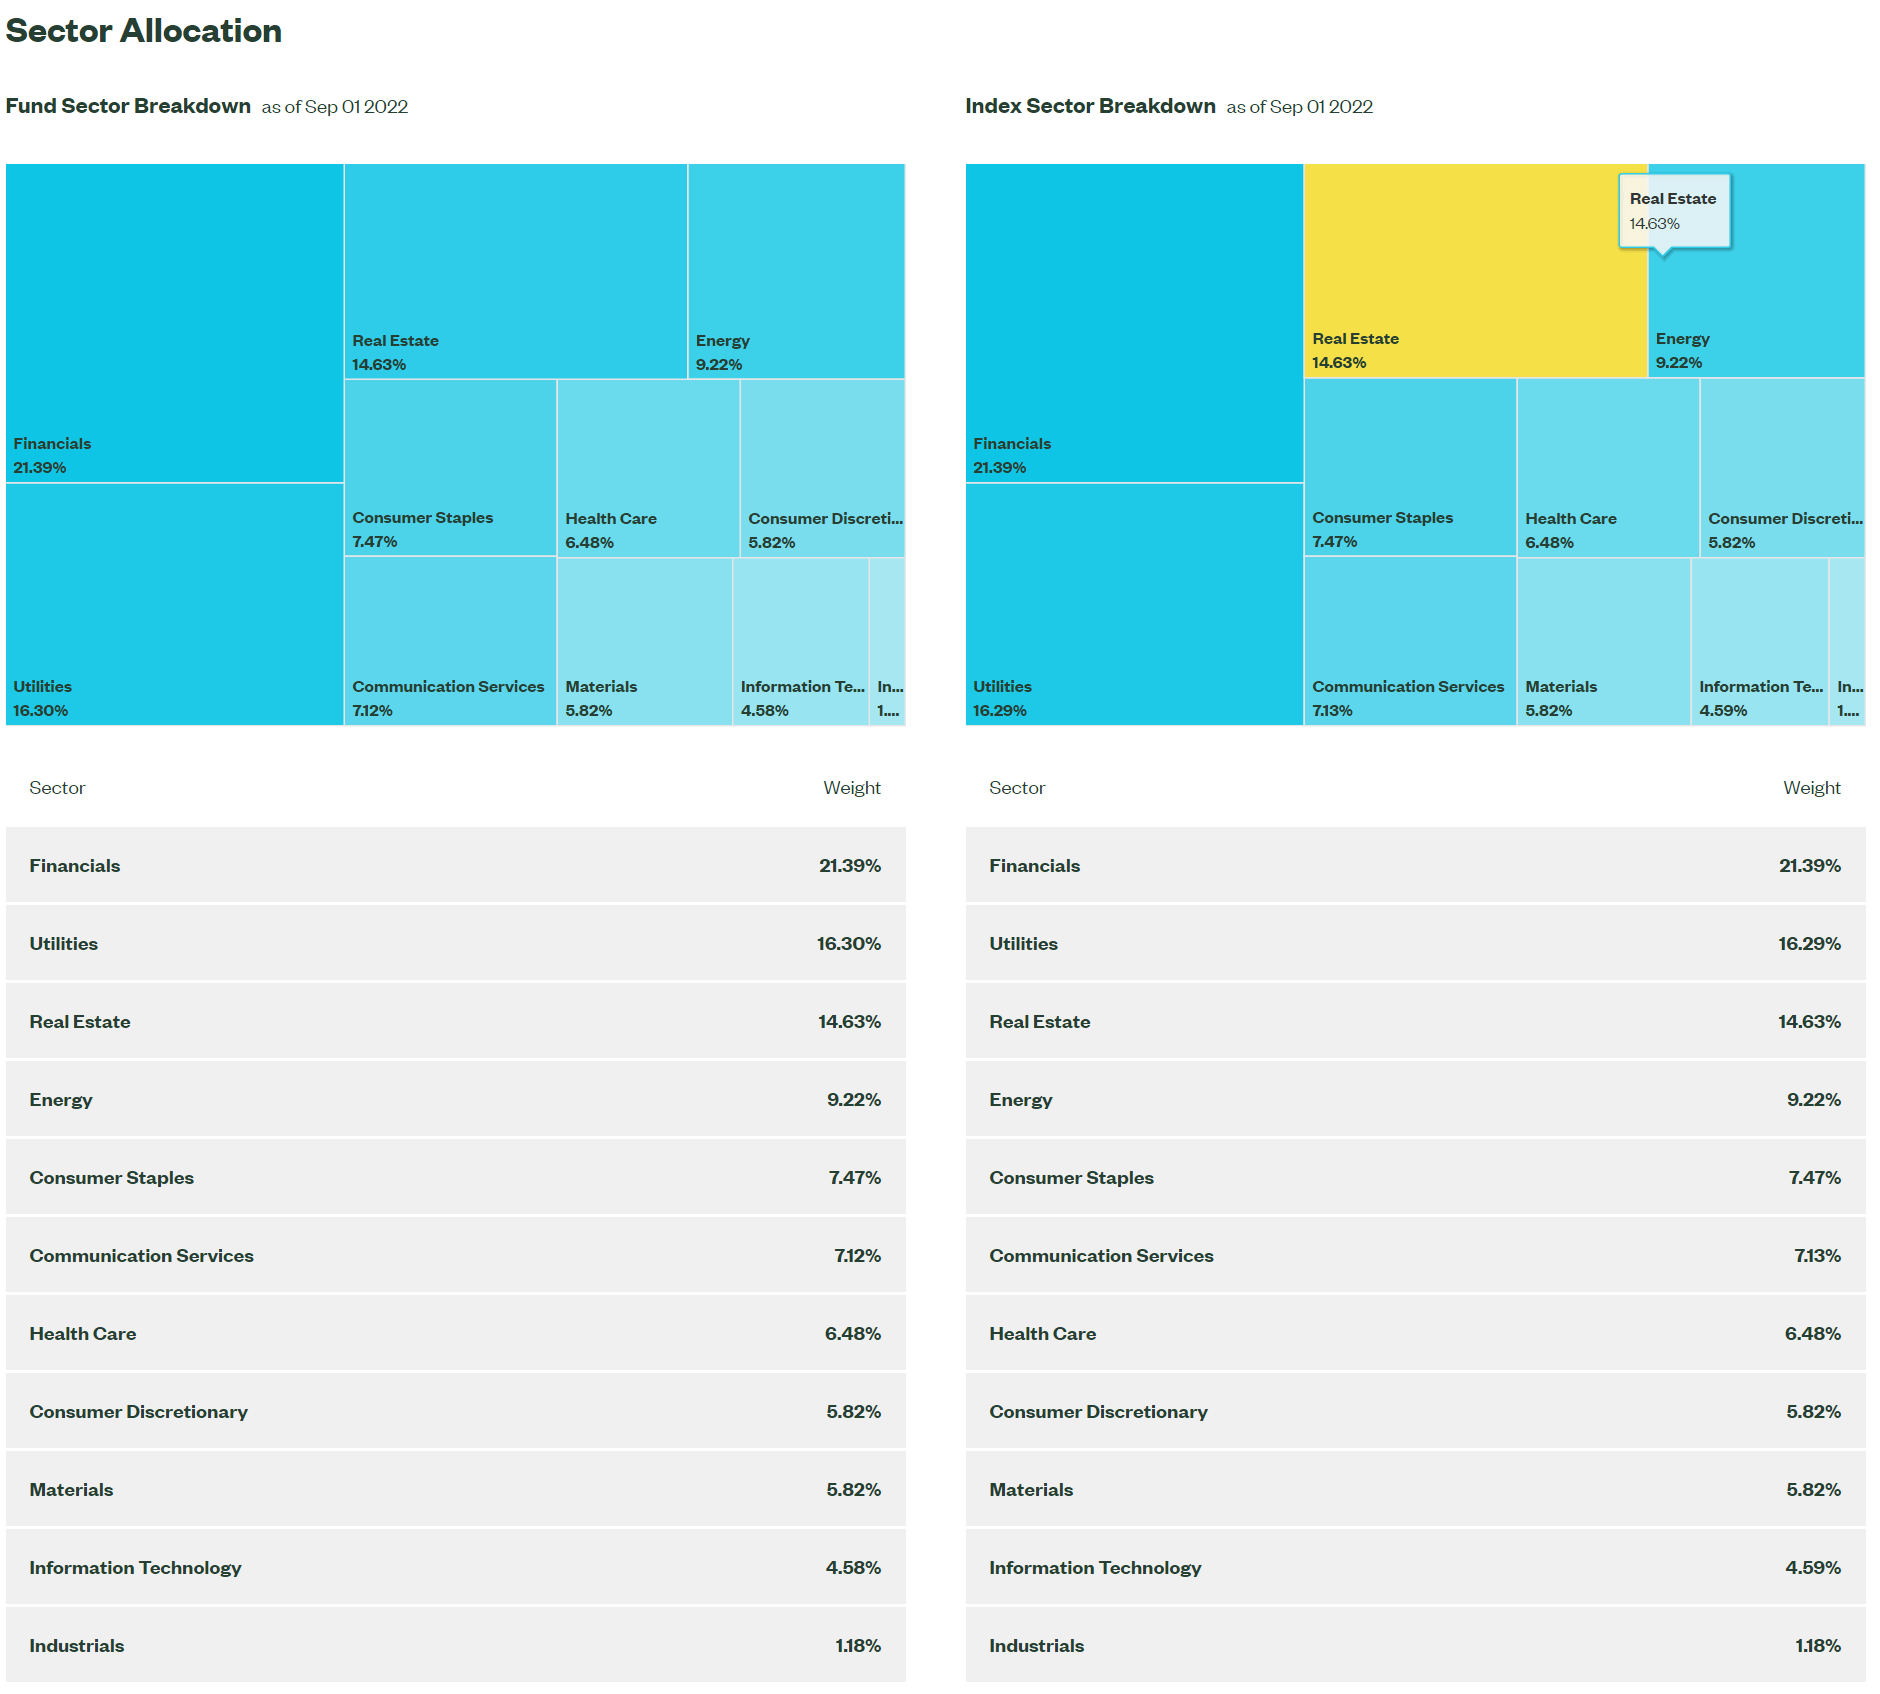
Figure 1 – SPYD sector allocation (SSGA)
Figure 1 – SPYD sector allocation (SSGA)
In general, the fund has had solid long-term returns, with 3 and 5 year returns of 8.1% of NAV, to July 31st (Figure 2). However, this lags significantly behind the S&P 500 returns of 13.4% and 12.8% respectively for the same period. Also notable is that YTD, the SPYD ETF has managed to generate positive returns of 0.9% vs. the S&P 500 return of -12.6%.
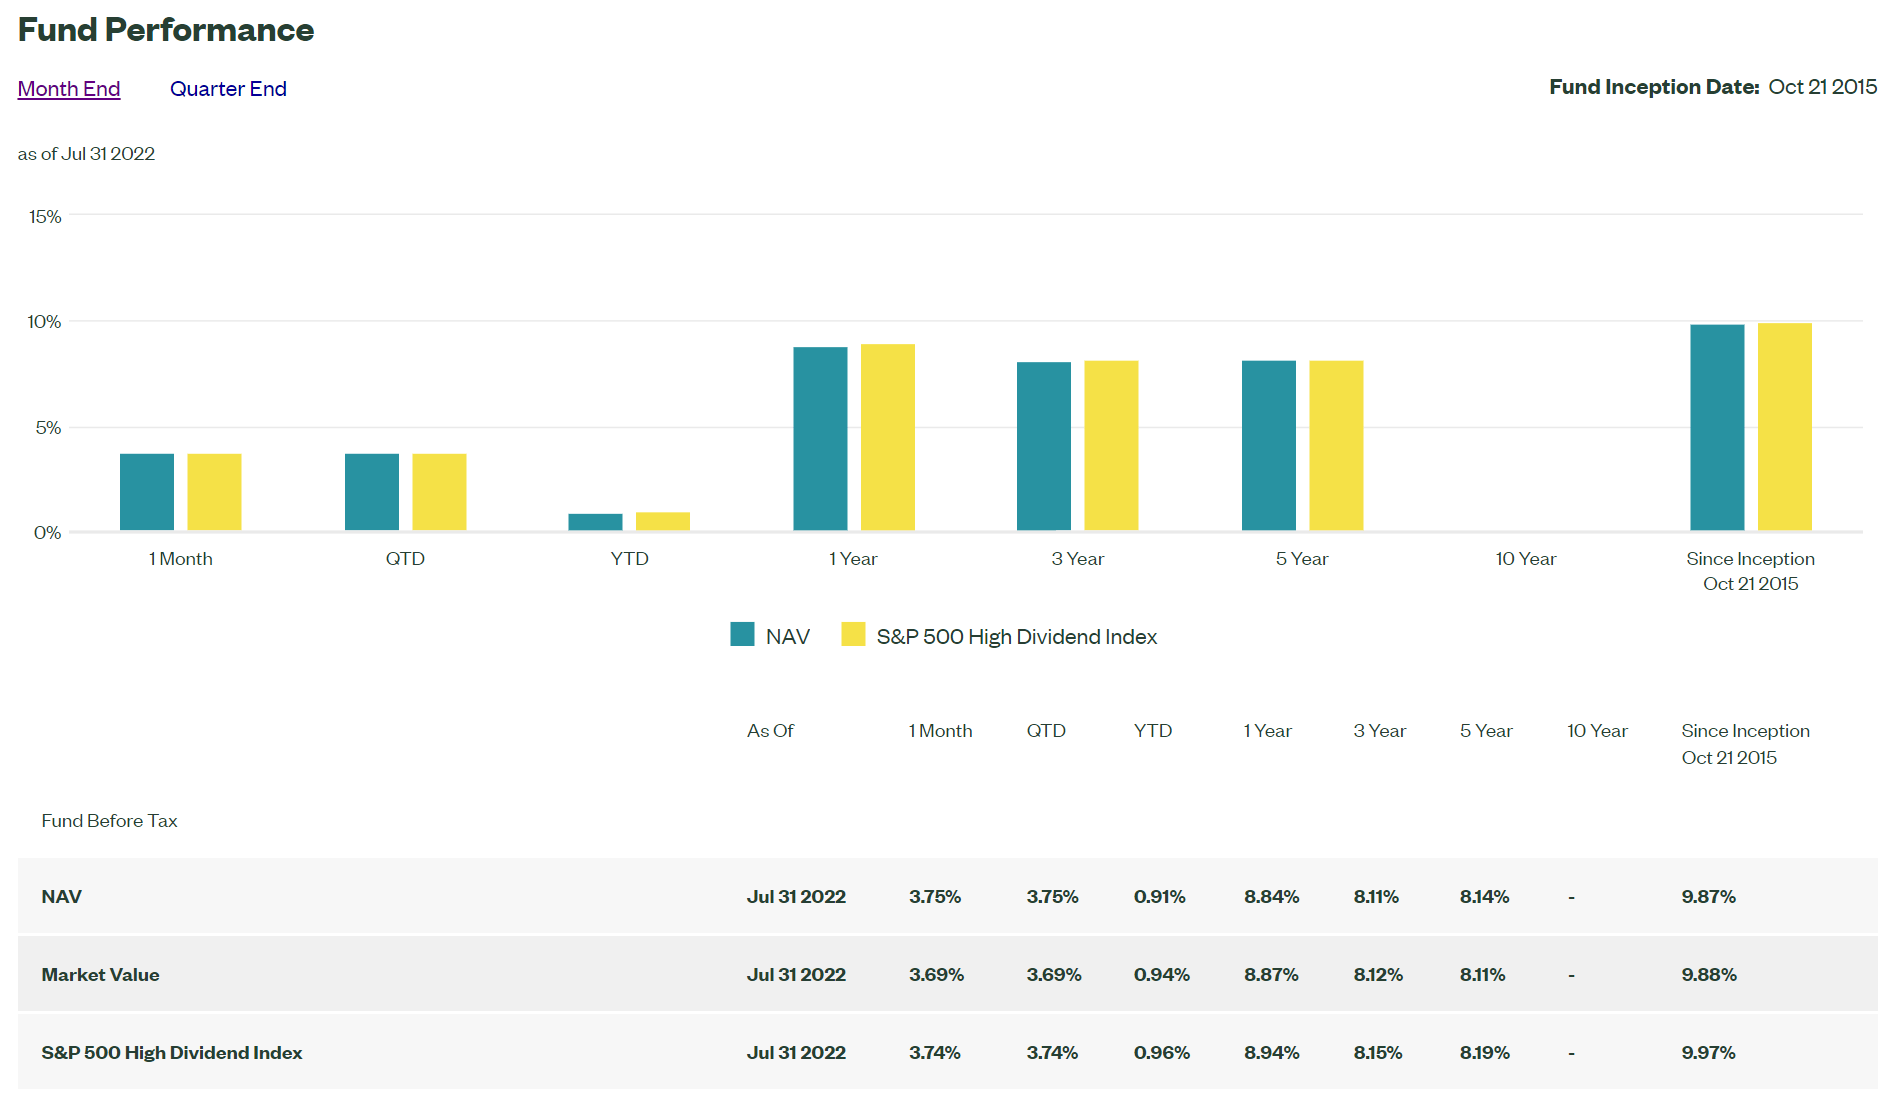
Figure 2 – SPYD performance (SSGA)
Figure 2 – SPYD performance (SSGA)
Comparing SPYD’s performance to its peer group, the Large Cap Value funds as defined by Morningstar, we see SPYD’s performance has been volatile. In its short history, SPYD is either top quartile or bottom quartile (Figure 3).
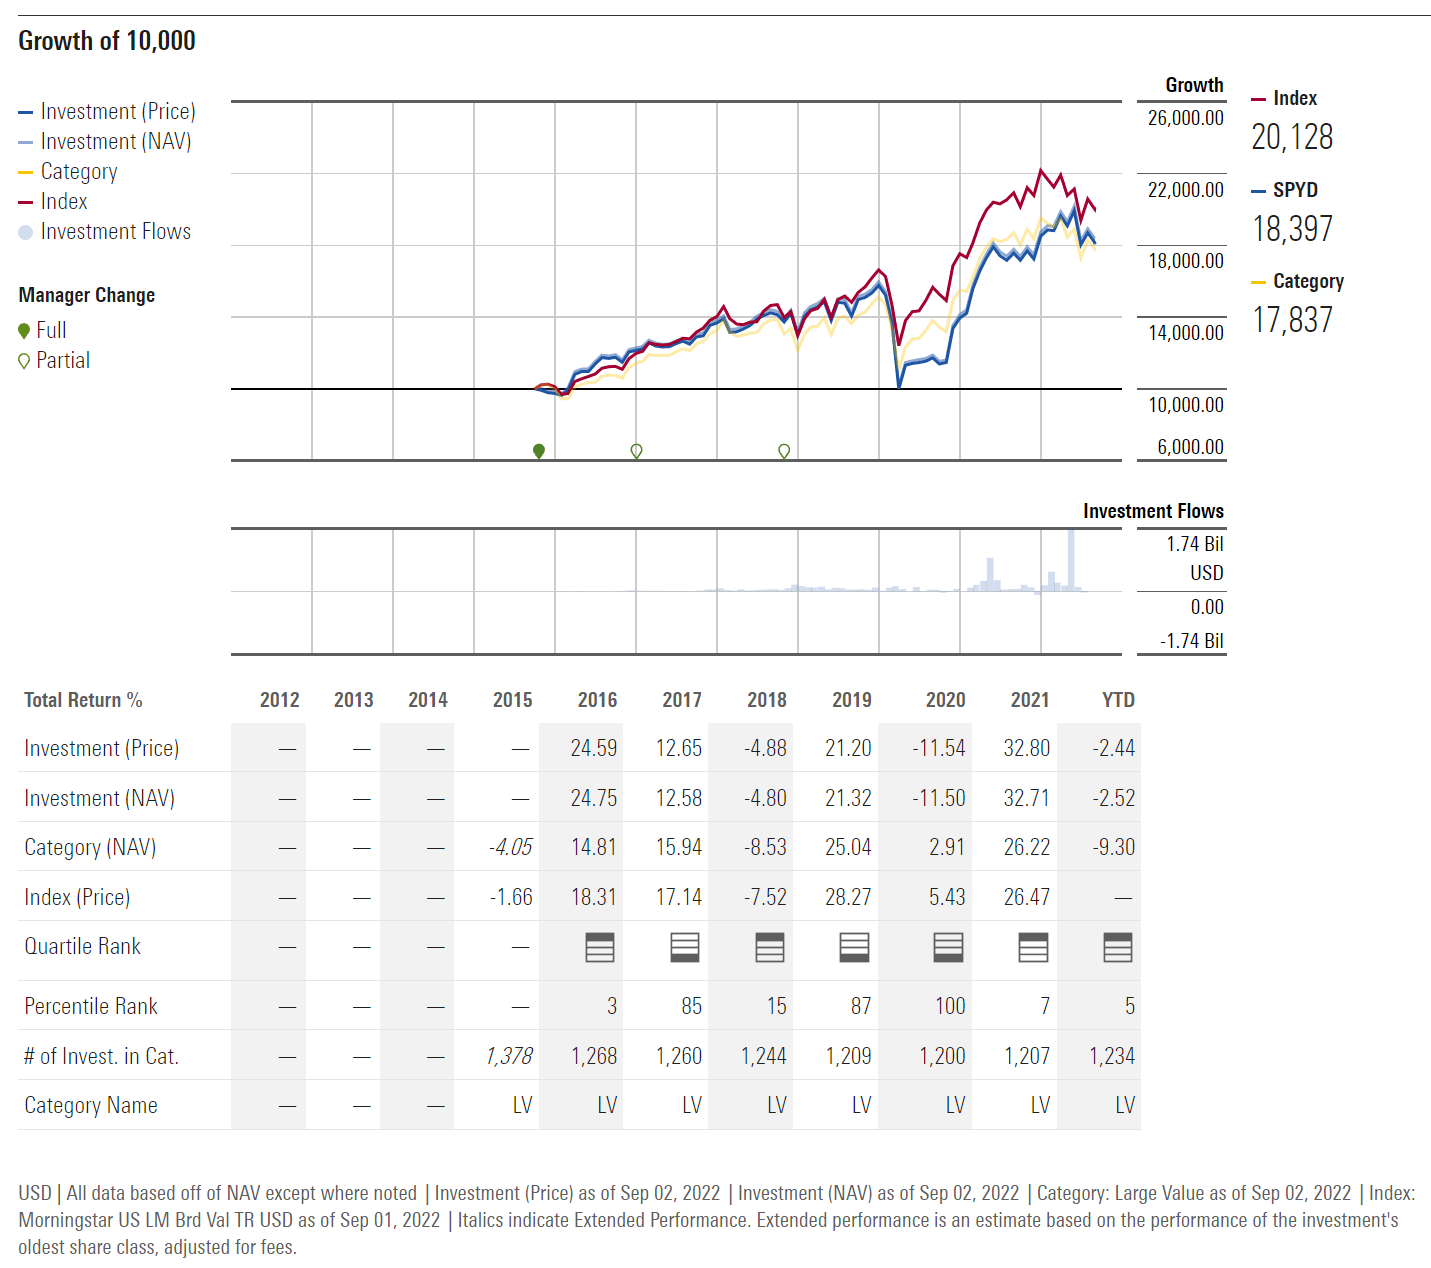
Figure 3 – SPYD vs. peers (Morningstar)
Figure 3 – SPYD vs. peers (Morningstar)
It also has higher volatility and lower returns than its index and category, on both a 3 and 5 year basis (Figure 4).
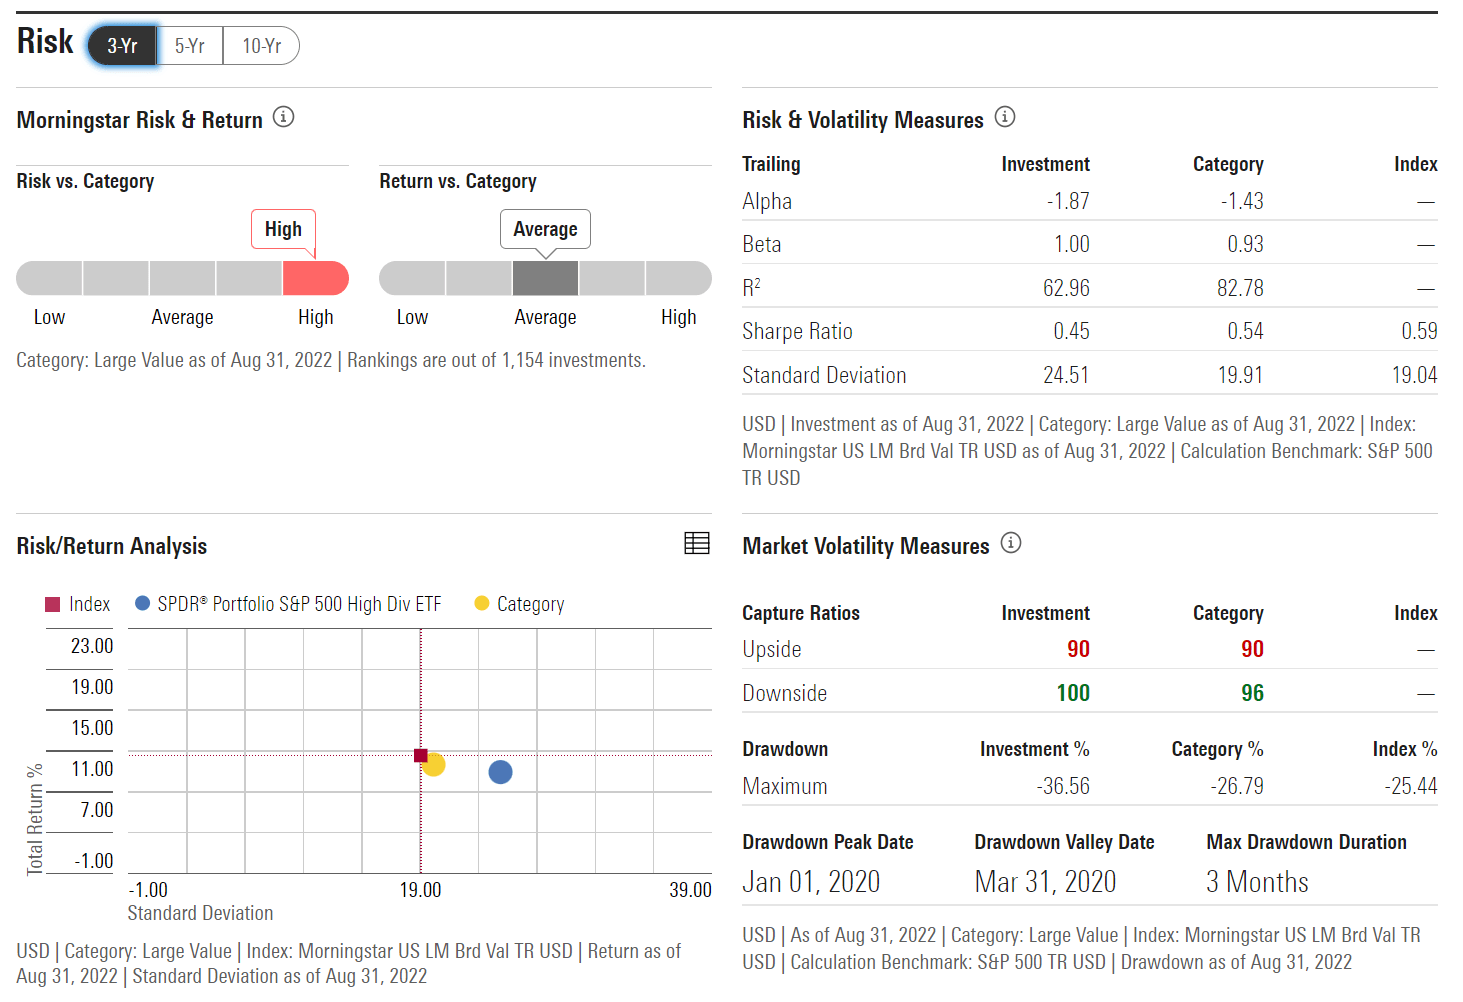
Figure 4 – SPYD volatility and returns against peers (Morningstar)
Figure 4 – SPYD volatility and returns against peers (Morningstar)
SPYD is a high yielding fund, with a 30 Day SEC yield of 4.35% and an LTM distribution yield of 3.9% (Figure 5). This is more than double the S&P 500’s 1.7% distribution yield.
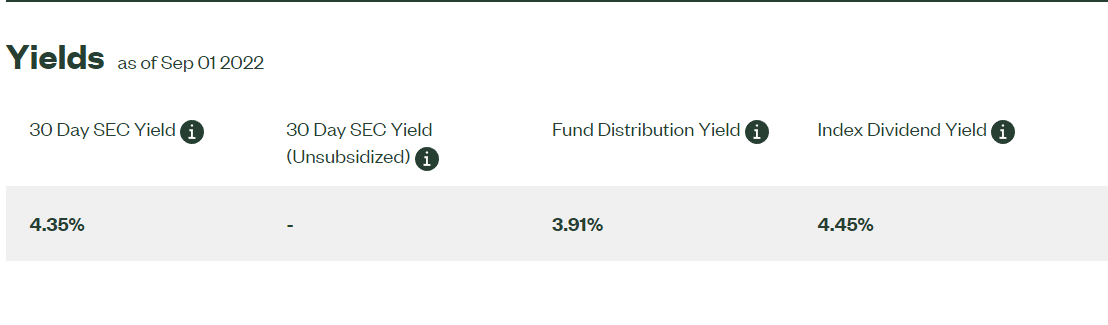
Figure 5 – SPYD distribution yield (SSGA)
Figure 5 – SPYD distribution yield (SSGA)
SPYD’s distribution is variable and paid quarterly. Its most recent distribution was $0.405/share, paid on June 23, 2022. There is no discernible trend to SPYD’s distribution, as it has fluctuated on a year-to-year basis and is dependent on the dividends from the underlying securities.
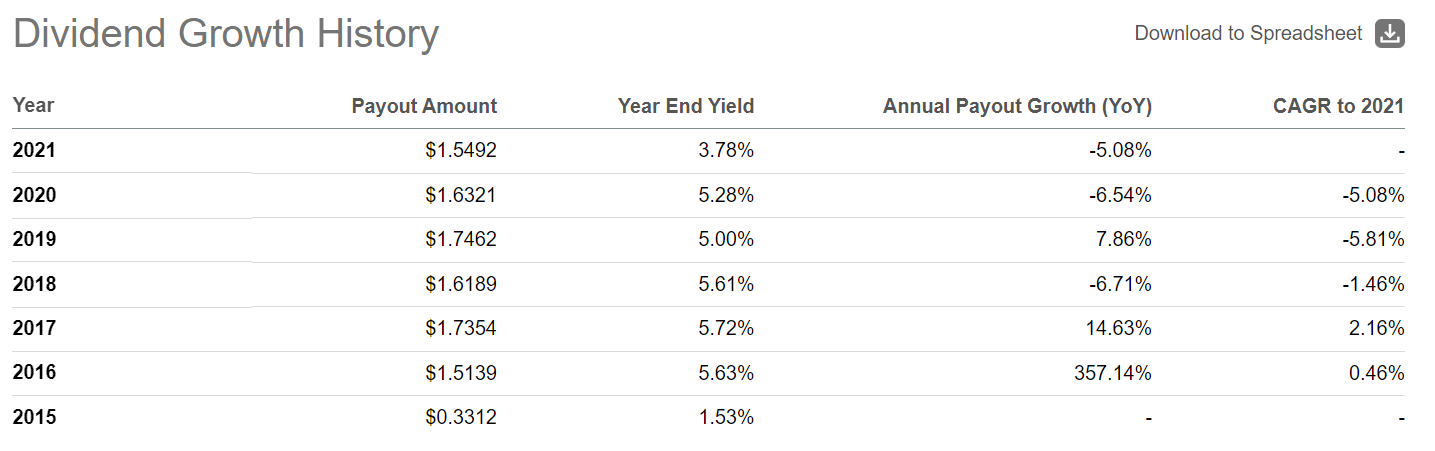
Figure 6 – SPYD distribution history (Seeking Alpha)
Figure 6 – SPYD distribution history (Seeking Alpha)
SPYD is a low cost fund, with gross expense ratio of 0.07%. While returns are variable, fees are not. Selecting low cost funds, all else equal, will lead to higher long-term returns.
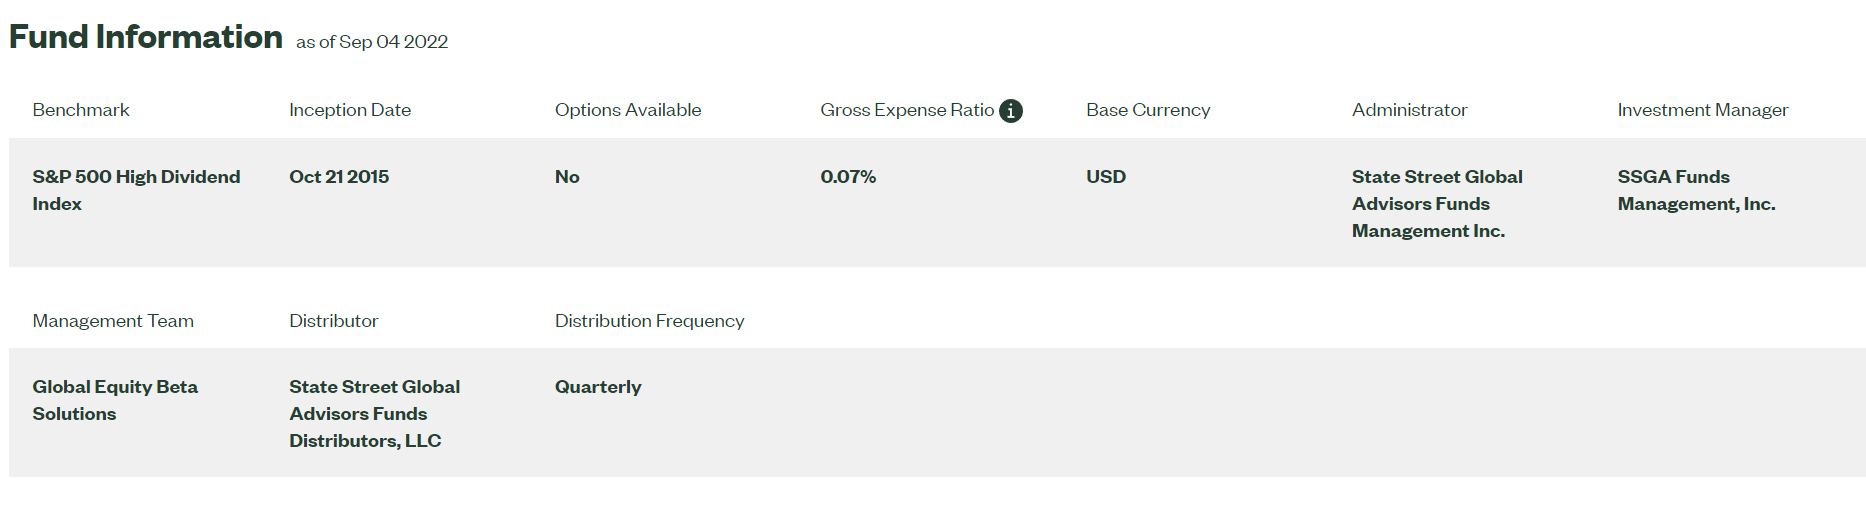
Figure 7 – SPYD fees (SSGA)
Figure 7 – SPYD fees (SSGA)
Readers are encouraged to read my in depth article on the merits of the Schwab U.S. Dividend Equity ETF before the following comparison between the SPYD ETF and the SCHD ETF.
First, using Portfolio Visualizer to compare the two funds, we note that SCHD has a much higher annualized CAGR return of 12.9% compared to SPYD’s 8.9% for the time period analyzed (November 2015 to August 2022).
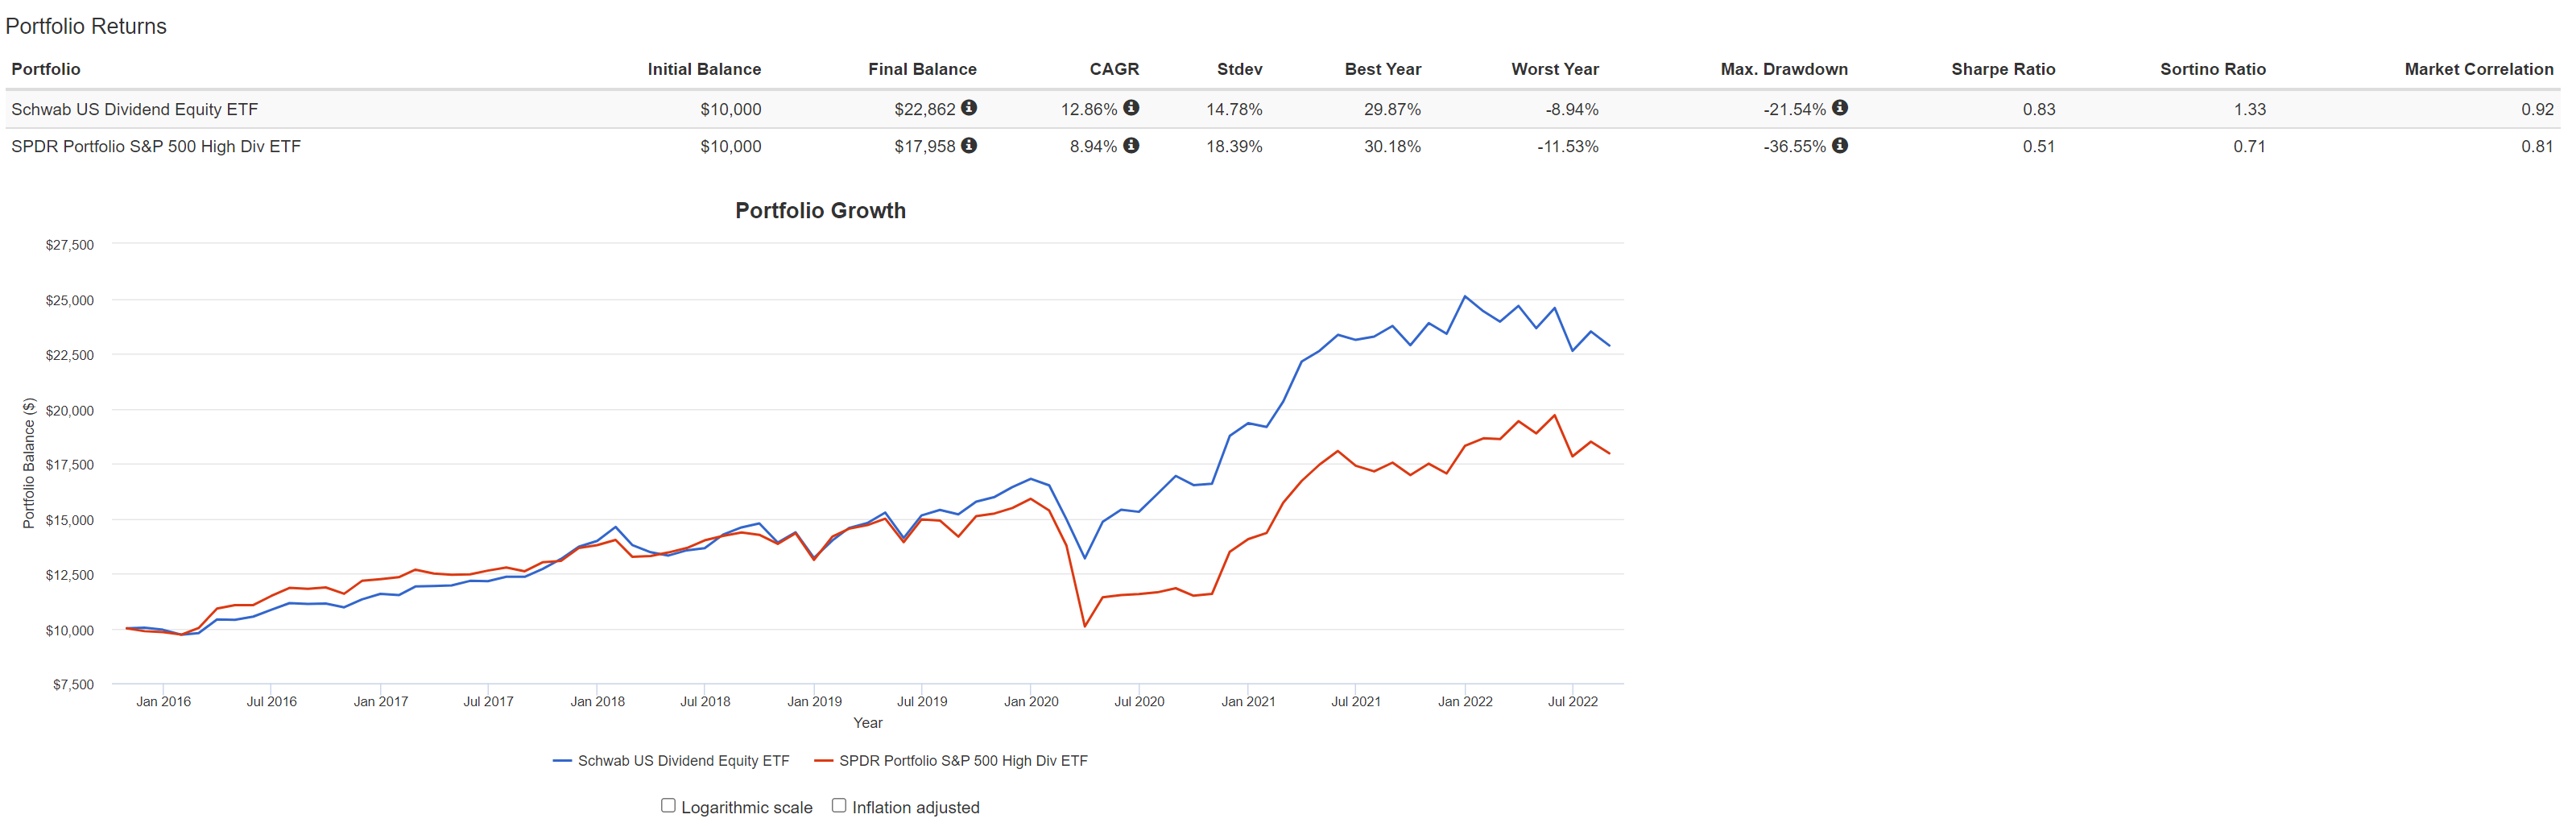
Figure 8 – SPYD vs. SCHD (Author created using Portfolio Visualizer)
Figure 8 – SPYD vs. SCHD (Author created using Portfolio Visualizer)
Comparing the risk metrics, SCHD also comes out ahead, as it has lower Stdev (14.8% vs. 18.4%), lower max drawdowns (21.5% vs. 36.6%), and higher Sharpe ratio (0.83 vs. 0.51).
Where SPYD comes out ahead is in 2022 returns YTD, where SPYD is down -1.8% vs. SCHD’s -8.9% (Figure 9). The reason behind SPYD’s better performance YTD is its larger allocation to the defensive sectors, as well as energy companies.
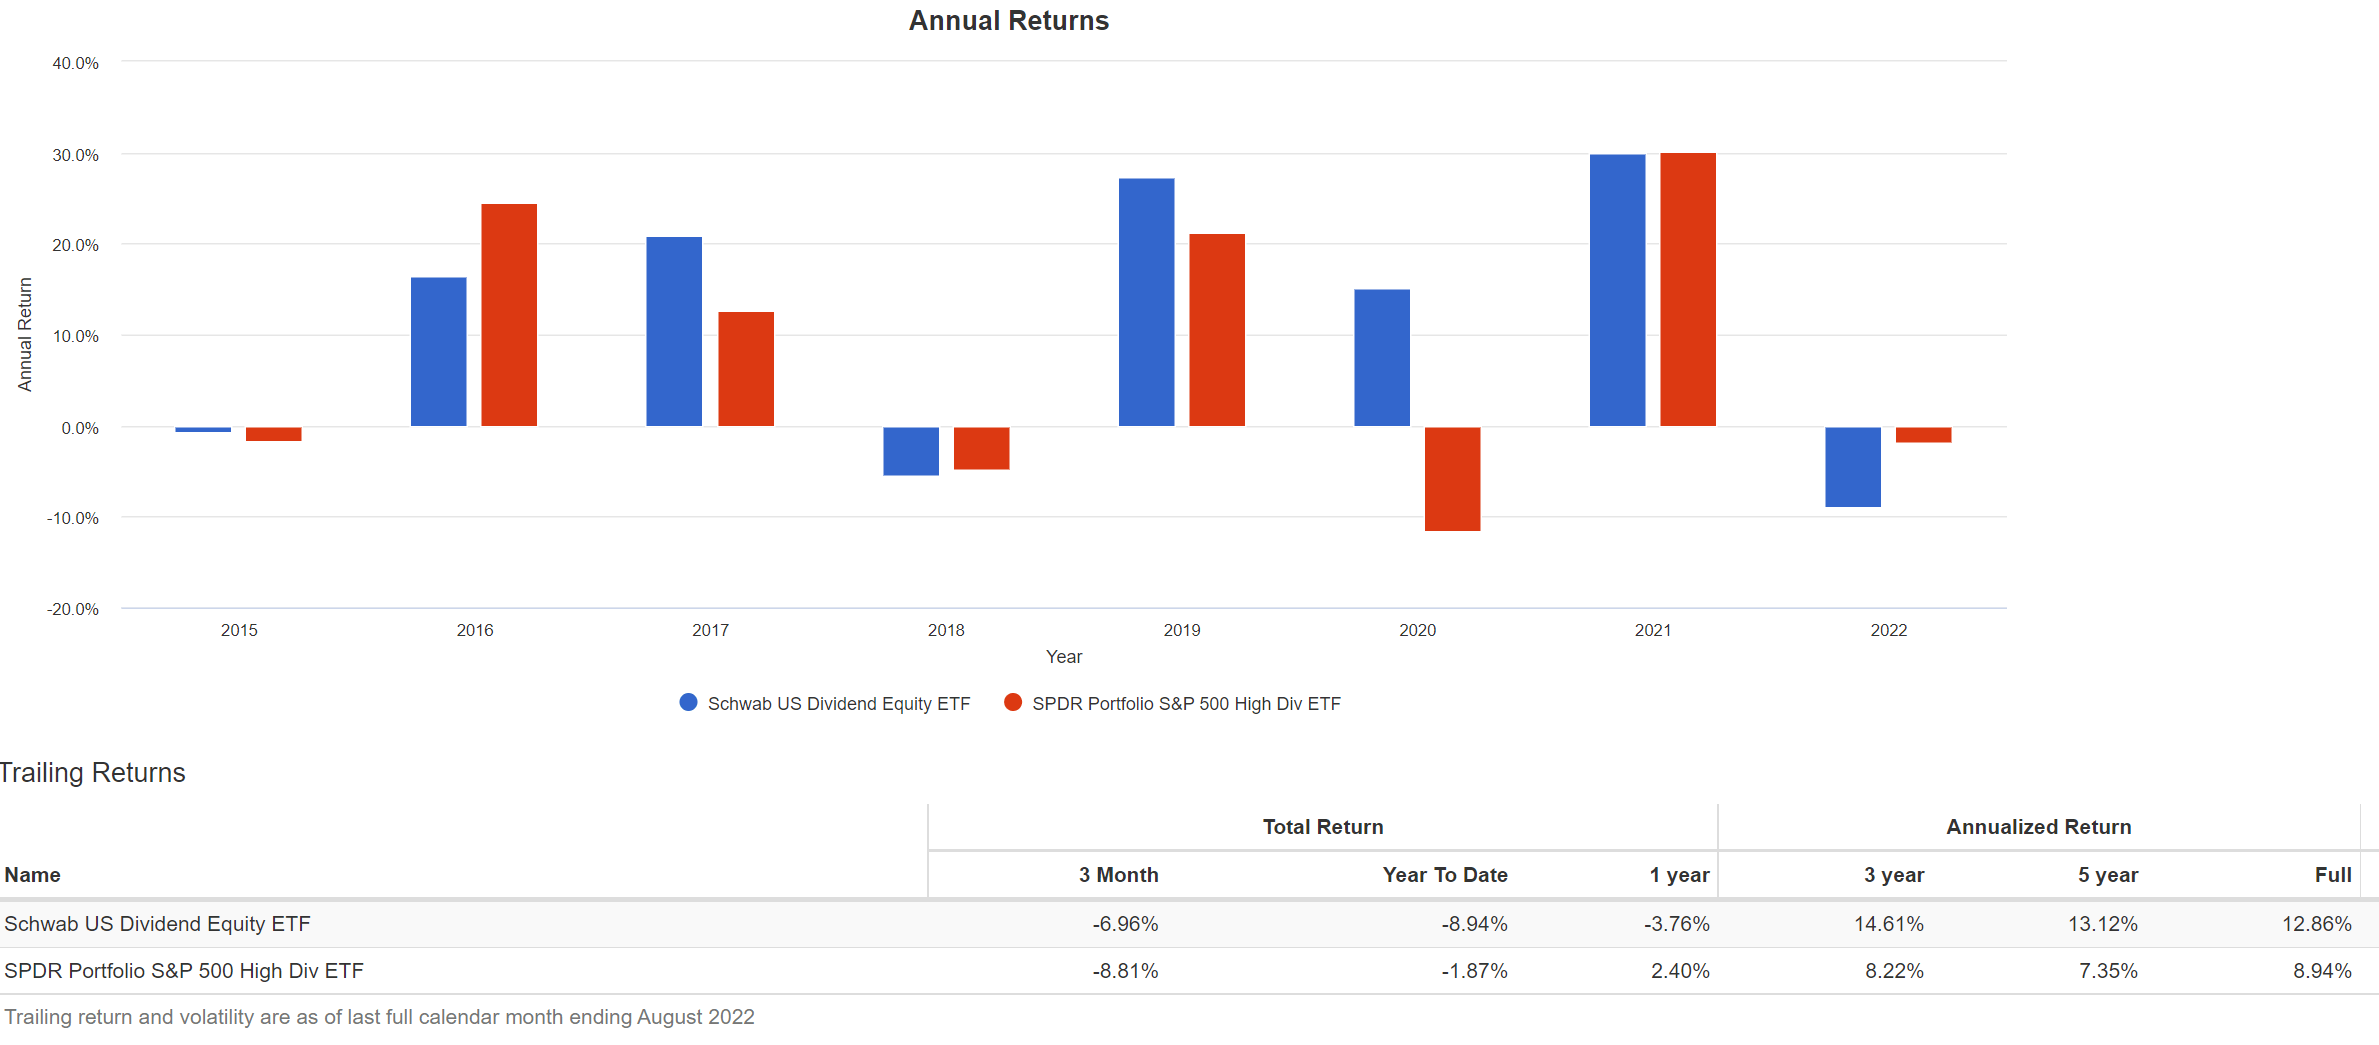
Figure 9 – SPYD vs. SCHD annual returns (Author created with Portfolio Visualizer)
Figure 9 – SPYD vs. SCHD annual returns (Author created with Portfolio Visualizer)
Next, comparing the distribution yield, SPYD has a higher LTM distribution yield of 3.9% compared to SCHD’s 3.2%. However, it should be noted that SPYD’s distribution is volatile (can be up or down from year to year), whereas SCHD has been consistently growing is distribution at over 10% CAGR since inception (Figure 10).
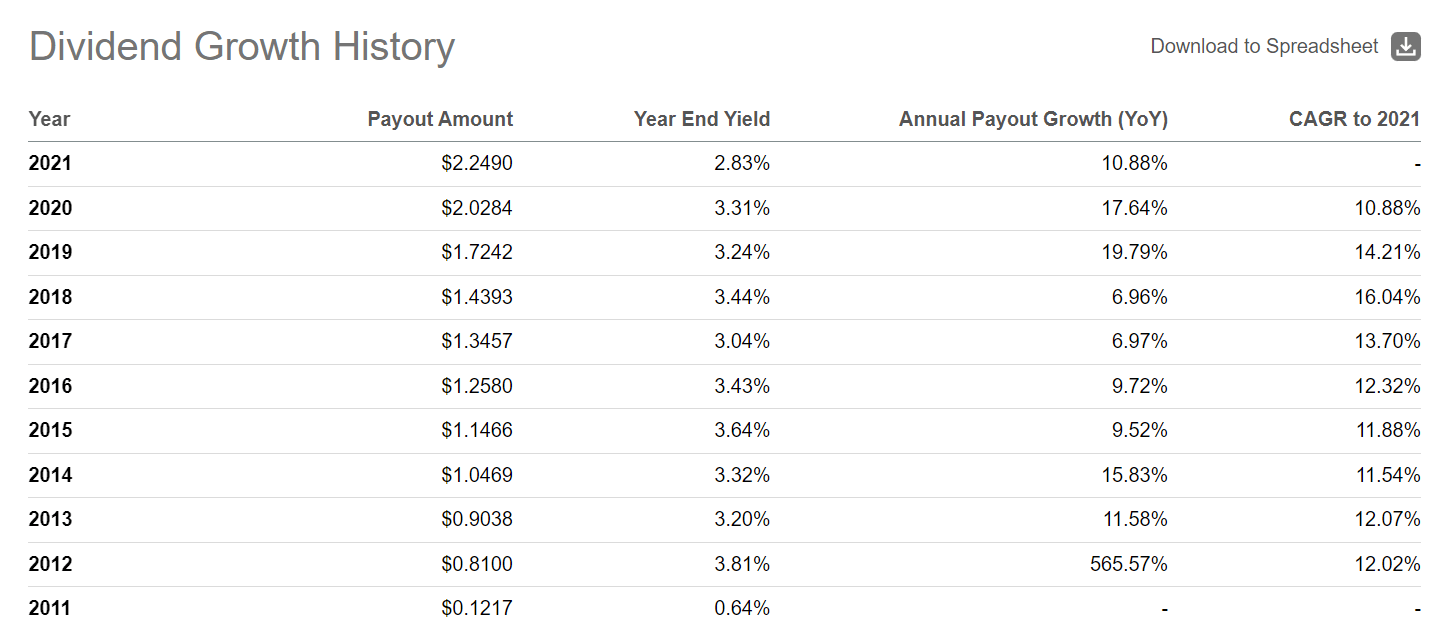
Figure 10 – SCHD distribution history (Seeking Alpha)
Figure 10 – SCHD distribution history (Seeking Alpha)
In terms of fees, the two funds are comparable, with SPYD charging a gross expense ratio of 0.07% and SCHD having a 0.06% expense ratio.
Finally, let’s compare the strategy between the two funds. SPYD’s strategy, as I understand it, simply looks at the highest dividend yielding companies in the S&P 500 as of the index date, and selects the highest 80. The strategy does not consider the financial strength of the company, nor the historical trend of the dividend. The strategy may bias the fund towards defensive sectors and cyclical value sectors such as financials and energy companies.
In contrast, SCHD’s strategy screens companies for cash flow to debt, return on equity, dividend yield, and 5-year dividend growth rate. This screening tends to focus the fund on companies that have shown financial strength, high returns, and a willingness to increase dividends over time.
While SPYD has outperformed SCHD so far in 2022, I believe SCHD has the better mouse trap, as demonstrated by its higher historical returns and better risk metrics. Furthermore, SCHD’s strategy has had a history of growing distributions at a high rate while screening for financial strength, whereas SPYD’s strategy only looks at the dividend yield factor, which can come and go in favour, leading to volatile returns and distributions.
In summary, while I like SPYD’s high current yield and YTD performance, I still prefer SCHD as my income pick because I believe SCHD has a better overall investment strategy design that weighs financial strength along with dividend yield. My biggest fear for the SPYD is that it has sizeable weights in the cyclical financial and energy sectors that may cause steep drawdowns if the economy really goes into a recession.
This article was written by
Disclosure: I/we have a beneficial long position in the shares of SCHD either through stock ownership, options, or other derivatives. I wrote this article myself, and it expresses my own opinions. I am not receiving compensation for it (other than from Seeking Alpha). I have no business relationship with any company whose stock is mentioned in this article.