
DNY59
DNY59
With respect to government debt, the U.S. economy has gone through a substantial transition over the past fifteen years.
First, though, take a look at the growth of public debt since the 1960s. The trend is up in the early years, but public debt growth really takes off in late 2007.
Then there is another jump and further spurt beginning with the spread of the Covid-19 pandemic in 2020.
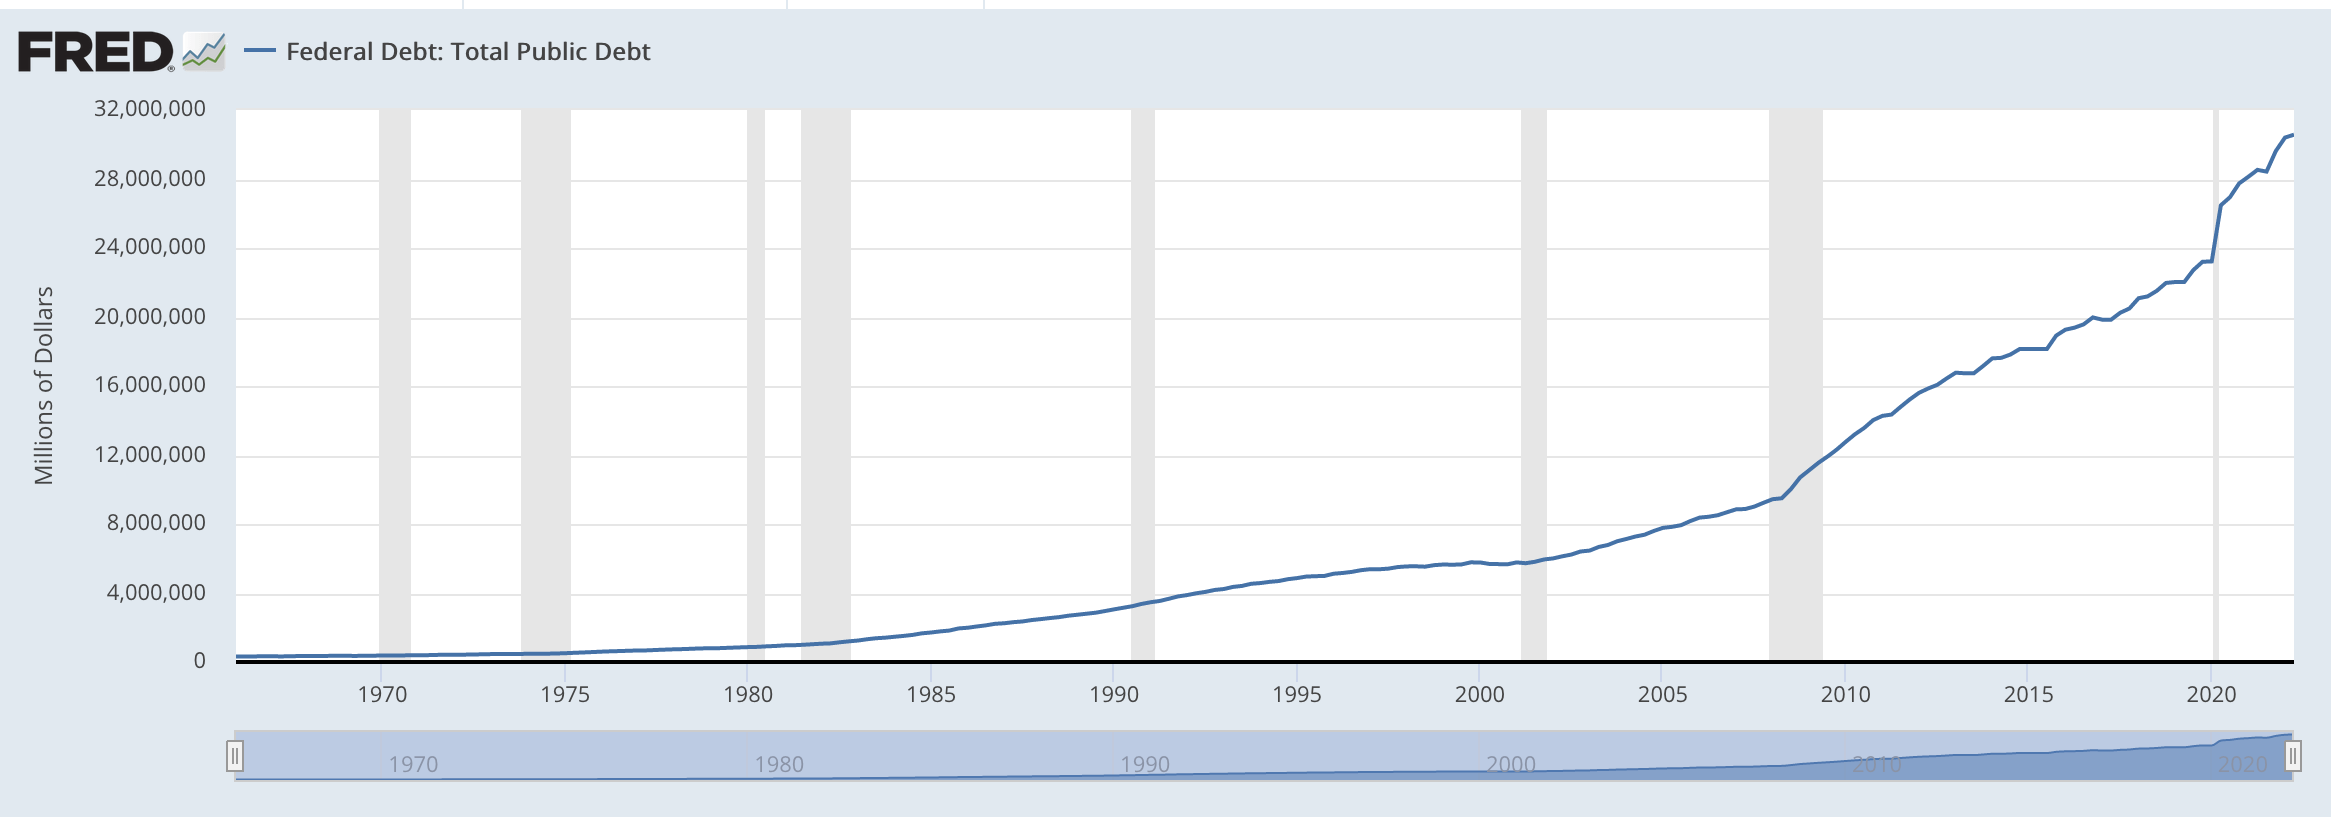
Growth of Federal Debt from the 1960s (Federal Reserve)
Growth of Federal Debt from the 1960s (Federal Reserve)
We can move from the longer-term view of this growing load of debt to one that just focuses on the time period since the beginning of the Great Recession in December of 2007. That is the time period we will be focusing upon the most in this post.
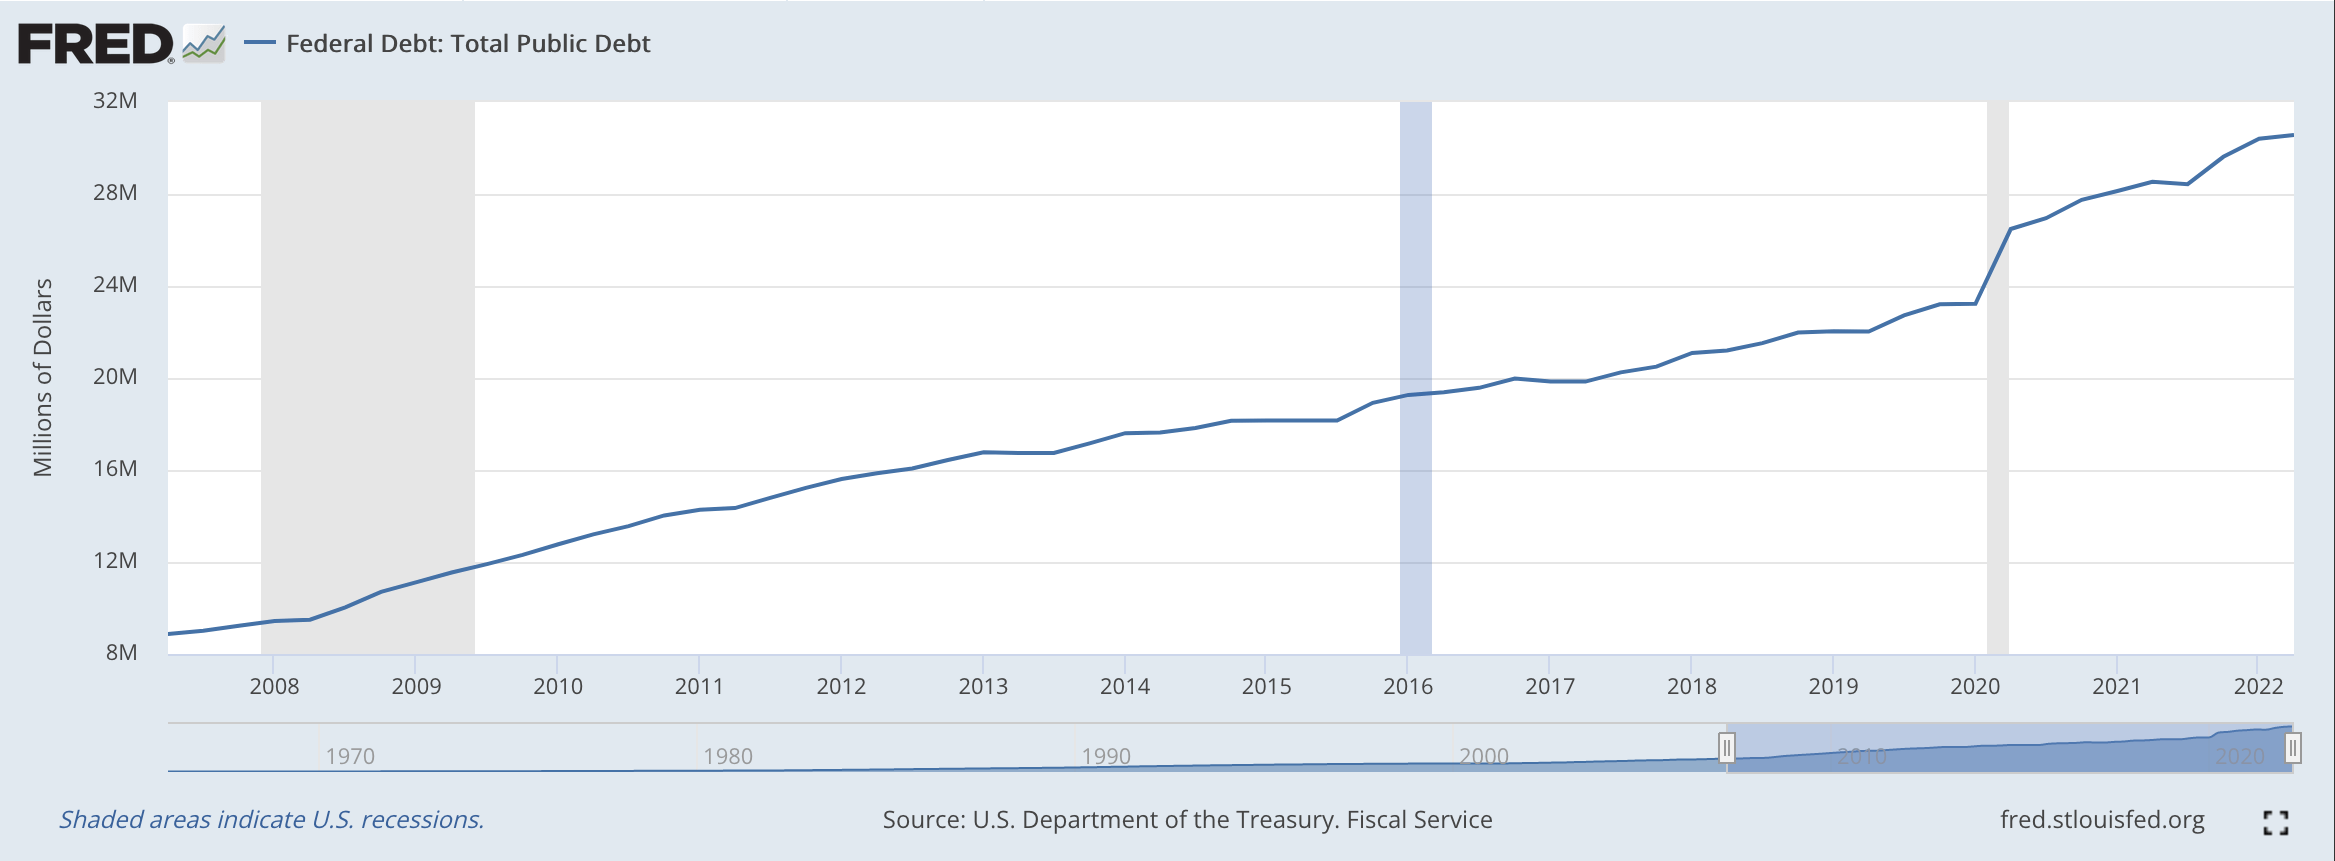
Federal Debt: Total Public Debt (Federal Reserve)
Federal Debt: Total Public Debt (Federal Reserve)
The crucial thing to see in this chart is that this time period should be broken up into two periods.
The first, one can say, is the time of Bernanke, after the Fed chairman at this time, Ben Bernanke.
The second begins in early 2020, which is the time that the United States really began to be impacted by the spread of the Covid-19 pandemic.
Both of these changes separate the period that preceded the change from the one that followed.
Fiscal and monetary policy changed during the Great Recession. Ben Bernanke became the chairman of the Board of Governors of the Federal Reserve System.
Mr. Bernanke changed the way the Fed did business. First, Mr. Bernanke guided the Fed into stimulating stock prices so that the rising stock market would create a wealth effect incenting consumers to increase their spending.
In this, Mr. Bernanke was very successful.
But, Mr. Bernanke followed this up with two rounds of quantitative easing where the Fed would regularly buy government debt so as to provide for a continuous expansion of bank reserves so that the money supply could grow at a steady pace.
One can see the steady growth in the public debt during this time, but this growth in debt did not produce a major rise in interest rates because the Federal Reserve was regularly increasing its holdings of government securities.
What one can see is that the total public debt as a percentage of Gross Domestic Product rose substantially in the 2008 to 2019 time period. (We’ll look at the 2019 thru 2022 period later.)
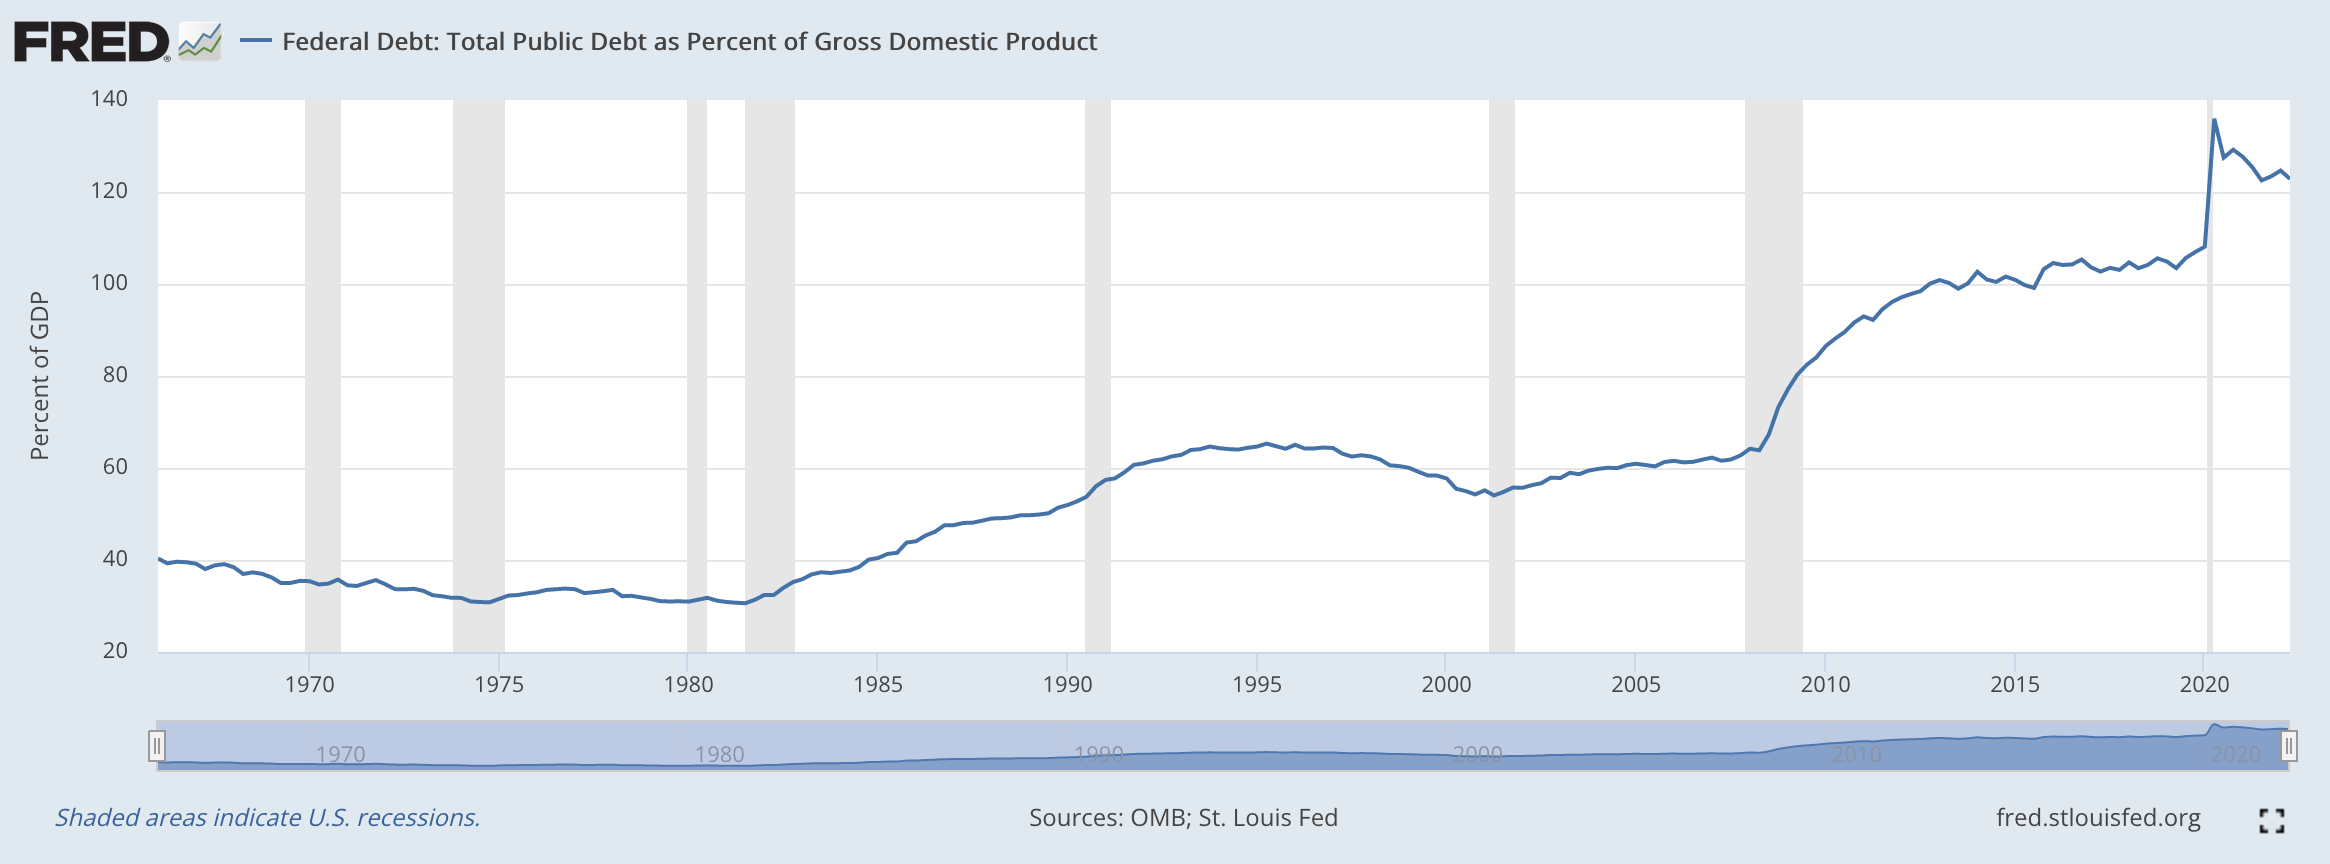
Public Debt as a percentage of GDP (Federal Reserve)
Public Debt as a percentage of GDP (Federal Reserve)
One can only conclude from this chart that the public began to hold on to a much larger proportion of the public debt than ever before.
The economy shifted during the economic expansion that followed the Great Recession. Public debt was a much bigger part of the financial pot and the private sector adjusted its behavior to absorb the greater amount of debt that was outstanding.
And, how did this growth in debt match up with the budgeting process taking place within the federal government?
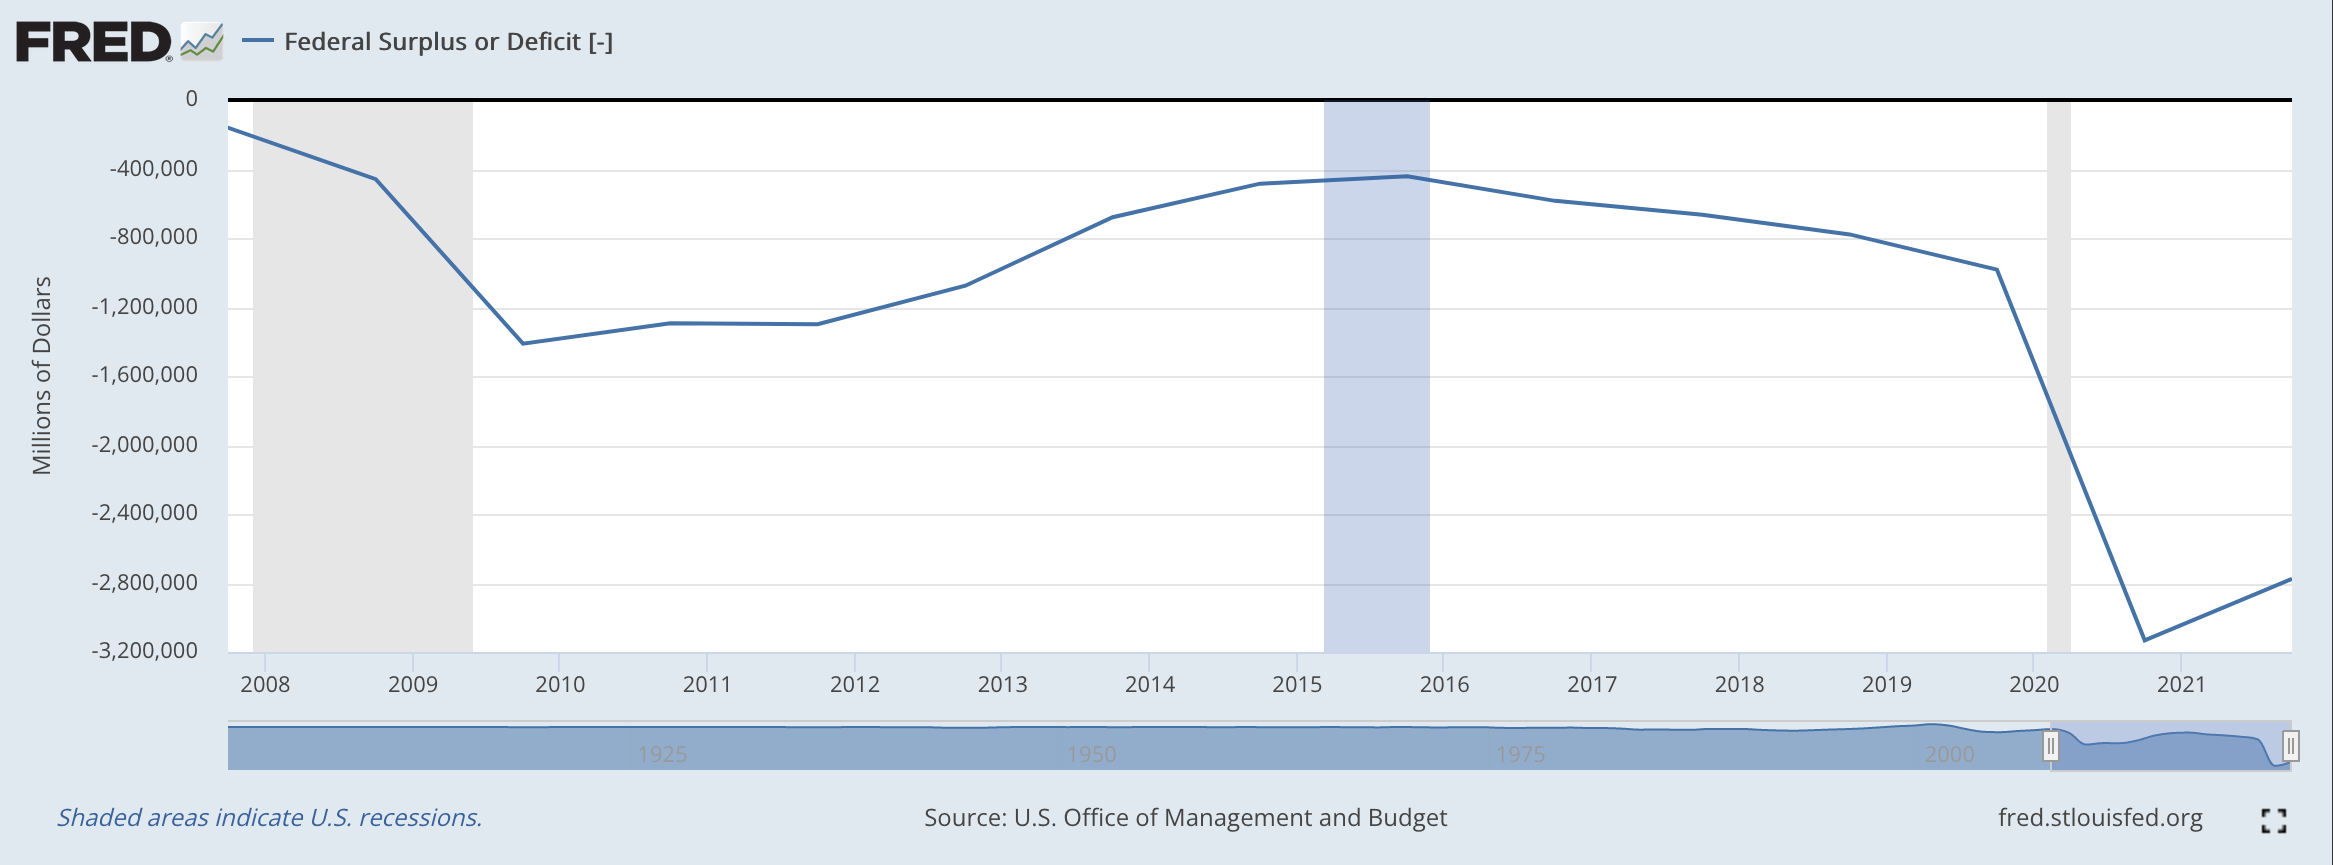
Federal Surplus or Deficit (Federal Reserve)
Federal Surplus or Deficit (Federal Reserve)
In the period beginning with the start of the Great Recession up until the spread of the Covid-19 pandemic. The federal government generated more deficit spending in any previous period before other than the deficit spending that occurred during the Second World War.
Never before in peacetime had the U.S. government generated so much debt.
The amazing thing is that this deficit spending did not end up creating a lot of monetary expansion to generate inflation.
In fact, inflation during the entire period of economic recovery following the Great Recession only amounted to a compound 2.3 percent per year.
What happened to inflation during this time period?
I have written many posts over the last fifteen years attempting to describe what happened during this period.
This was a time of “credit inflation” where the government’s stimulus money flowed into asset prices and not into real capital expenditures. That is, the stimulus money went into stock prices, real estate prices, commodity prices, gold prices, and other areas of a similar nature.
Money did not flow into real capital expenditures as it had in the past. So, lots and lots of wealth was created, but the wealth creation did not come through making the economy more productive.
In fact, the growth of labor productivity during this period of time was less than one, hence contributing to very slow growth in real GDP during this time period.
The time was a very prosperous time, especially for the wealthier as the income/wealth distribution in the U.S. economy skewed more toward the top 10 percent of the wealth-holders. But, growth was steady and extended over a historically long period of time.
Then the Covid-19 pandemic hit the United States and was accompanied by the Covid-19 recession for two months.
One can see from the last chart that the government deficit exploded and the amount of public debt that was created was record-breaking.
The percentage of GDP held by the private sector took a radical jump upwards.
Again, one could argue that a “new” period evolved as investors accepted the greater debt loads and moved the debt created into their portfolios.
The amount of public debt outstanding grew enormously and people absorbed it into their portfolios.
The private sector had more help in this than in the disruptive period following the Great Recession.
This time around, the private sector received assistance from the Federal Reserve System. The Federal Reserve jumped right into action, doing what it could to combat the potential disruption of the Covid-19 pandemic and the economic recession.
The Federal Reserve also began buying $120.0 billion of U.S. Treasury securities and mortgage-backed securities every month.
On December 25, 2019, the Federal Reserve had, on its balance sheet, $3.8 trillion in U.S. Treasury securities bought outright.
On December 29, 2021, the Fed had $8.3 trillion in U.S, Treasury securities bought outright on its balance sheet.
This was an enormous increase!
The point is that the massive amount of securities the federal government was issuing got placed.
But, one can see the amount of the deficit that was accepted over the past two years or so.
One can also see the incredible increase in the percentage of GDP that the private sector now held.
So, the structure of the world, and the structure of investment portfolios, have changed over the past 15 years.
What is going to happen now?
Almost all the changes over the last fifteen years have occurred because of economic disruptions and the changes in the economic programs of the federal government and the Federal Reserve.
Will these changes stick, or, will these changes prove to represent markets in disequilibrium that must work themselves out of this disequilibrium?
This is what the Federal Reserve and the investment community are going to have to work out over the next several years.
It will be a time of great uncertainty and great changes.
I will be a time when lots of money will change hands, one way or another.
This article was written by
Disclosure: I/we have no stock, option or similar derivative position in any of the companies mentioned, and no plans to initiate any such positions within the next 72 hours. I wrote this article myself, and it expresses my own opinions. I am not receiving compensation for it (other than from Seeking Alpha). I have no business relationship with any company whose stock is mentioned in this article.


