

Kwarkot/iStock via Getty Images
Kwarkot/iStock via Getty Images
(This article was co-produced with Hoya Capital Real Estate)
In this article I will review two International Real Estate ETFs even though this is an asset class that has done poorly compared to the Vanguard Real Estate ETF (VNQ) which invests in the US REITs market. The picture is more mixed for the iShares International Developed Property ETF (NYSEARCA:WPS), but the clear laggard is the Vanguard Global ex-U.S. Real Estate ETF (NASDAQ:VNQI). More on that in the Portfolio strategy section of this article.
One factor that effects USD investors when putting funds into assets priced in other currencies is the movement of the USD against those currencies unless the investor, or in this scenario, the ETFs hedge against that effect; neither of these ETFs hedge.
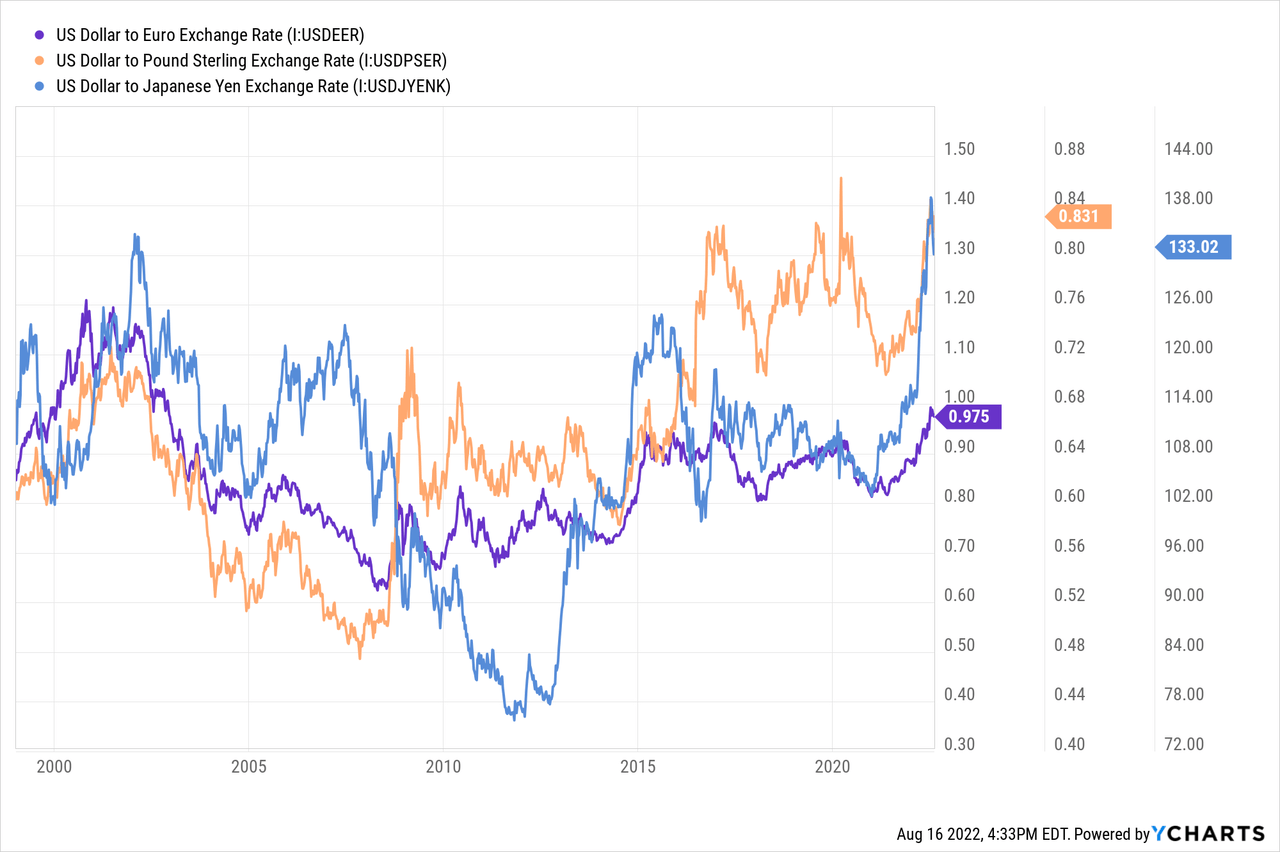
Currently the USD is on a tear, almost reaching the peak hit at the height of the COVID panic. While that strength is not good for foreign assets, when the USD reverses course and weakens versus these currencies, it should add to the performance of both ETFs covered here. For more on the subject, here are links to recent Seeking Alpha articles about the strength of the USD:
I give WPS a BUY rating in lieu of buying a Total International equity ETF, but a HOLD when the other investment would be a Developed International equity ETF. I would pass on VNQI for international exposure.
Seeking Alpha describes this ETF as:
iShares International Developed Property ETF is an exchange traded fund launched by BlackRock, Inc. It is managed by BlackRock Fund Advisors. It invests in public equity markets of global ex-US region. The fund invests in stocks of companies operating across real estate sectors. It invests in growth and value stocks of companies across diversified market capitalization. WPS may invest up to 20% of its assets in certain futures, options and swap contracts, cash and cash equivalents, as well as in securities not included in the index, but which BFA believes will help the fund track the index. The fund seeks to track the performance of the S&P Developed ex-U.S. Property Index. WPS started in 2007.
Source: seekingalpha.com WPS
WPS has $62.5m in AUM and has a TTM yield of 4.67%. The managers charge 48bps in fees.
With WPS investing based on an Index, some understanding of that index is important. S&P describes the Index used as:
The S&P Developed Ex-U.S. Property Index defines and measures the investable universe of publicly traded property companies domiciled in developed countries outside of the U.S. The companies included are engaged in real estate related activities, such as property ownership, management, development, rental and investment.
Source: spglobal.com Index
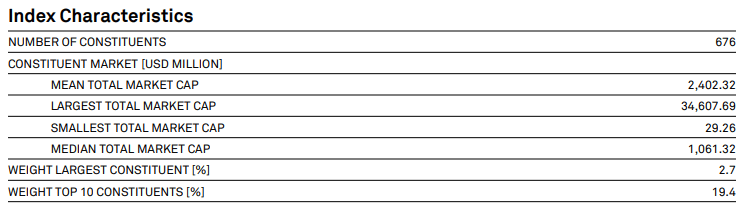
S&P provides some basic statistics on the Index.
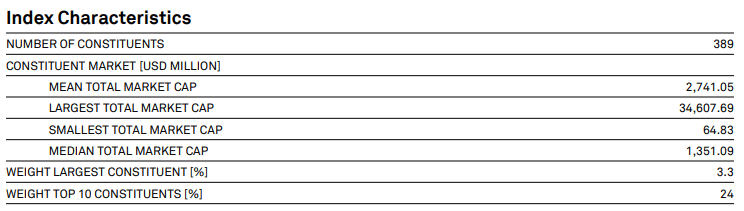
spglobal.com Index
spglobal.com Index
The Index is rebalanced annually in September with share changes and IPO updates in March, June, and December. The Property Index specifically excludes companies whose main source of revenue is derived from fees or interest earned when providing real estate services or financing. The REIT indices specifically exclude timber REITs, mortgage REITs, tower REITs, and mortgage-backed REITs. Over the past decade, the Index shows a 1.08% CAGR.
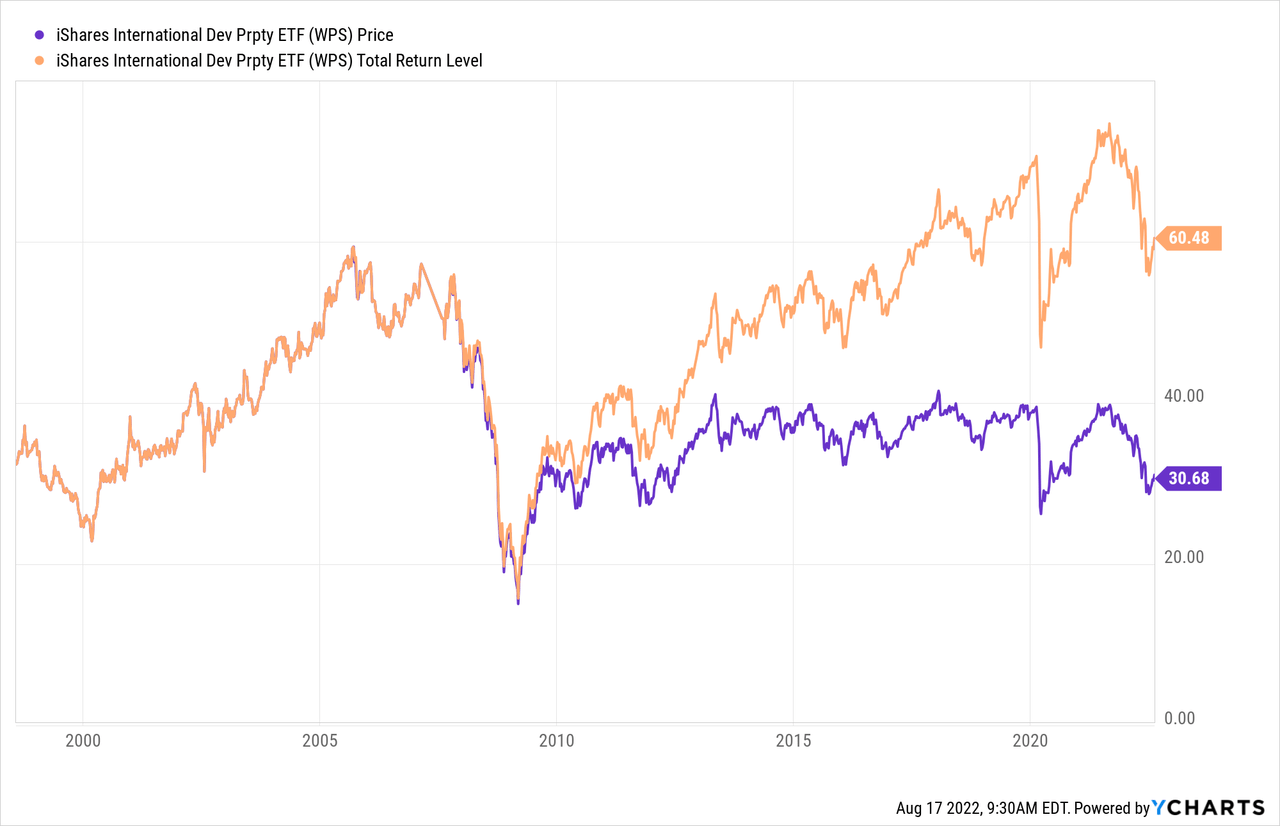
iShares provides a standard set of data points for their ETFs:
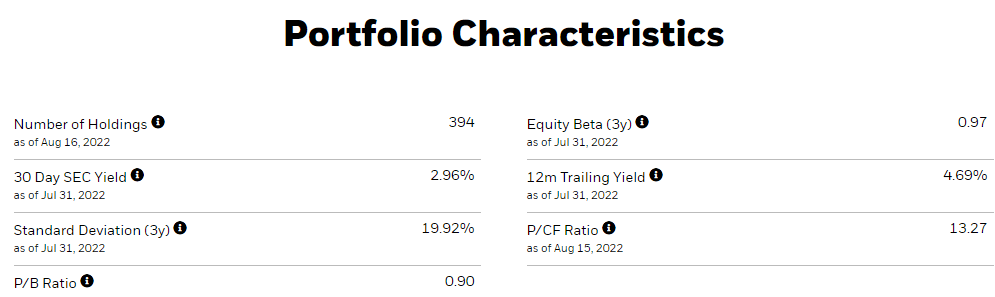
ishares.com WPS
ishares.com WPS
Like stocks, REITs also have sectors though different managers/index providers use different sets or even different assignments.
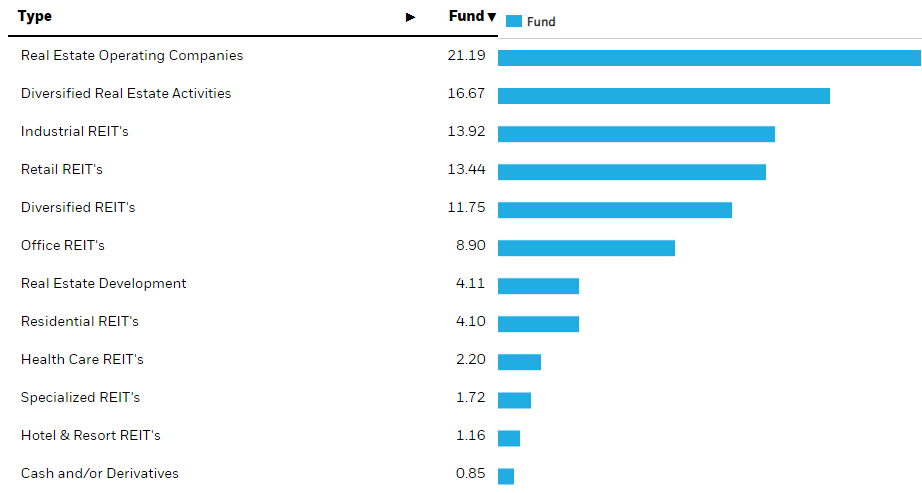
ishares.com WPS sectors
ishares.com WPS sectors
Because both of these ETFs use SPGlobal indices, the classifications match and I will compare them later in this article. The next table shows the allocations to the Top 10 countries.
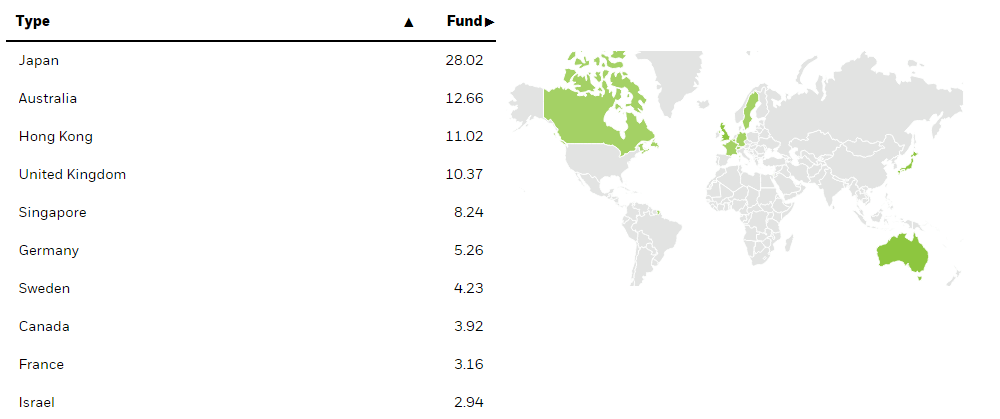
ishares.com WPS countries
ishares.com WPS countries
With the exception of no China allocation (by rule), the rest closely match VNQI. Noticed “developed” is not based on size but country and market rules/stability, thus Singapore and Israel are okay. Hong Kong is also based on historical designation.
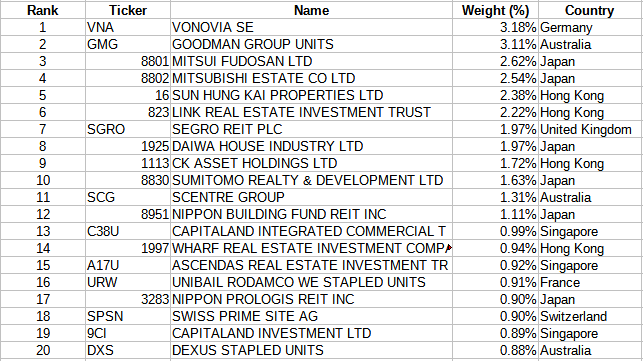
ishares.com; compiled by Author
ishares.com; compiled by Author
The Top 20 represent 33% out of a portfolio of nearly 400 holdings. About 1% of the assets are in currency holdings spread across 12+ countries.
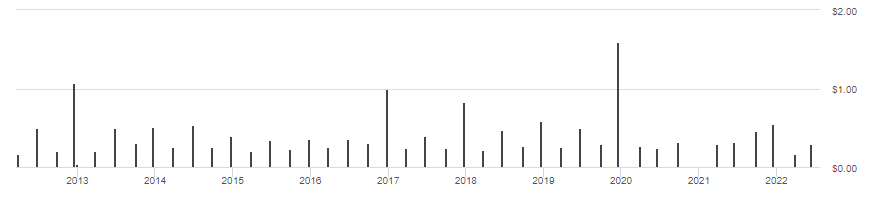
seekingalpha.com WPS DVDs
seekingalpha.com WPS DVDs
WPS follows a distribution pattern I recognize from other REIT ETFs recently reviewed; unsteady with little growth over time. Seeking Alpha gives WPS a “C” grade for their distribution history.
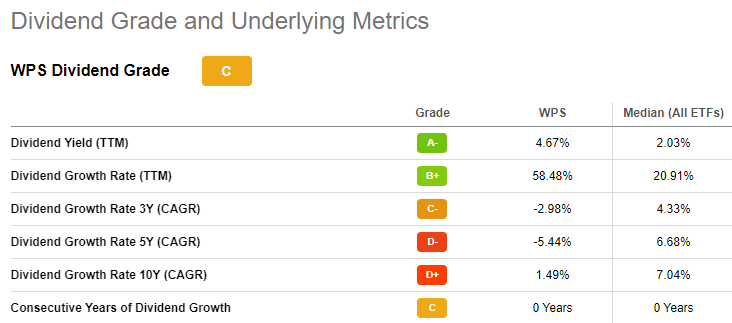
seekingalpha.com WPS scorecard
seekingalpha.com WPS scorecard
Seeking Alpha describes this ETF as:
Vanguard Global ex-U.S. Real Estate ETF is an exchange traded fund launched and managed by The Vanguard Group, Inc. The fund invests in public equity markets of global ex-US region. The fund invests in stocks of companies operating across real estate sectors. The fund invests in growth and value stocks of companies across diversified market capitalization. It seeks to track the performance of the S&P Global ex-U.S. Property Index. VNQI started in 2010.
Source: seekingalpha.com VNQI
VNQI has $4.2b in AUM with a 12bps fee structure. As you will see later, the distributions are too erratic to list a yield for VNQI.
S&P describes the Index use by VNQI as:
The S&P Global Ex-U.S. Property Index defines and measures the investable universe of publicly traded property companies domiciled in developed and emerging markets excluding the U.S. The companies included are engaged in real estate related activities such as property ownership, management, development, rental and investment.
Source: spglobal.com Index
spglobal.com Index
spglobal.com Index
This index has almost 300 more holdings than the non-EM version but average market-caps are about the same. Except for including Emerging Market country REITs, the rules are the same. I count roughly 16 EM countries with China (7.6%), India (1.7%) and the Philippines (1.4%) the largest three.
Vanguard provides these basic statistics for VNQI as of the end of July, the latest available.
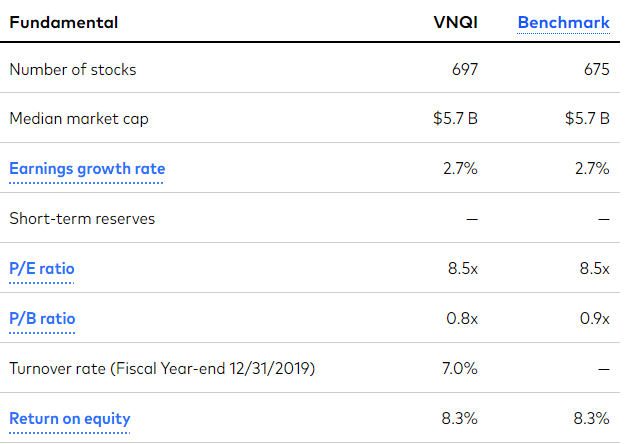
investor.vanguard.com VNQI
investor.vanguard.com VNQI
The allocations across regions are:
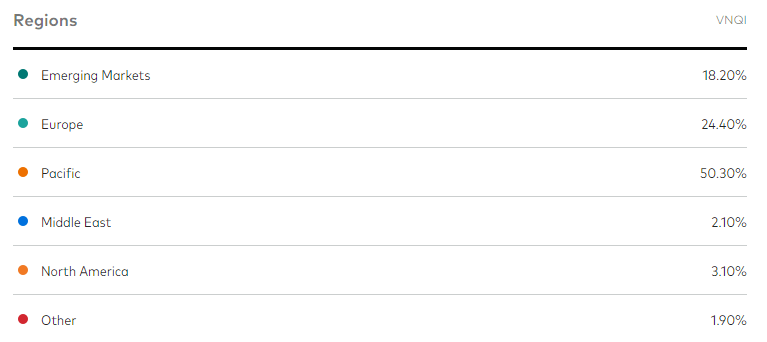
investor.vanguard.com regions
investor.vanguard.com regions
The Middle East includes a Developed country, Israel, and several Arab countries. The Top 10 country exposures are:
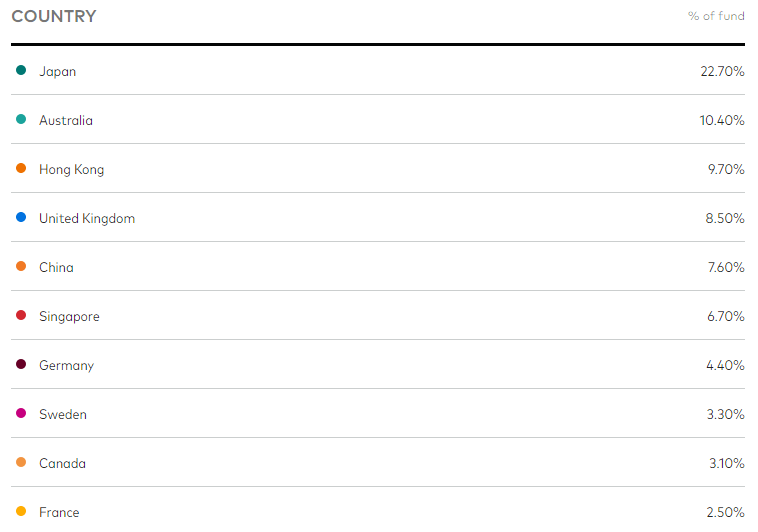
investor.vanguard.com countries
investor.vanguard.com countries
Note that Hong Kong comes in 3rd. Despite that designation, which is based on trading or incorporation of the asset, there could be mainland Chinese firms in this percentage. WPS holds Hong Kong REITs as an indication of its Developed World designation. Despite its placing 5th by weight, China has the most holdings at 103, followed by Japan at 87.
investor.vanguard.com sectors
investor.vanguard.com sectors
The largest holding is the 3% in the liquidity reserve, a common feature with Vanguard ETFs.
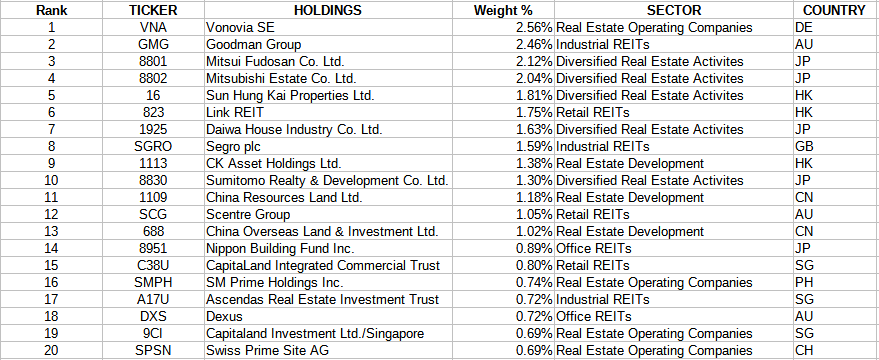
advisors.vanguard.com; compiled by Author
advisors.vanguard.com; compiled by Author
The Top 20 shown account for 27% of the market value of VNQI. The Top 10 in both ETFs are the same REITs in the same order.
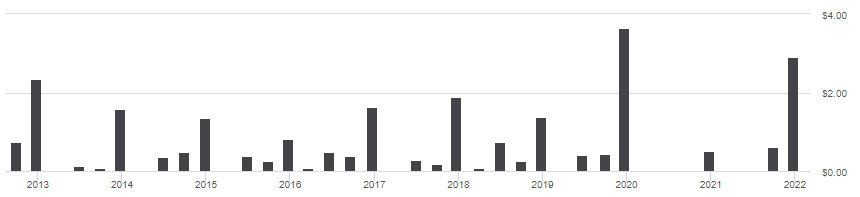
seekingalpha.com VNQI DVDs
seekingalpha.com VNQI DVDs
The above illustrates why I was reluctant to state a yield for VNQI. For investors looking for steady income, neither of these ETFs fit that need. Seeking Alpha doesn’t give VNQI a score for this factor.
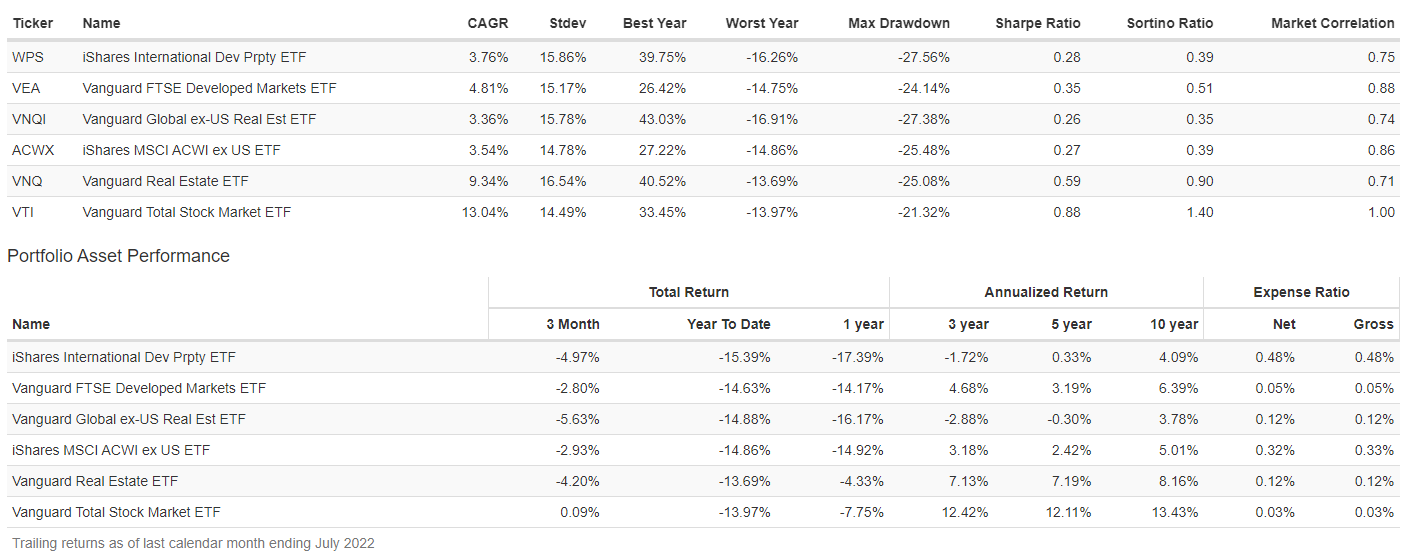
For some parts of this comparison, I included another popular International Developed REITs ETF, the SPDR Dow Jones International Real Estate ETF (RWX). We start with return and risk data, which shows why RWX wasn’t reviewed.
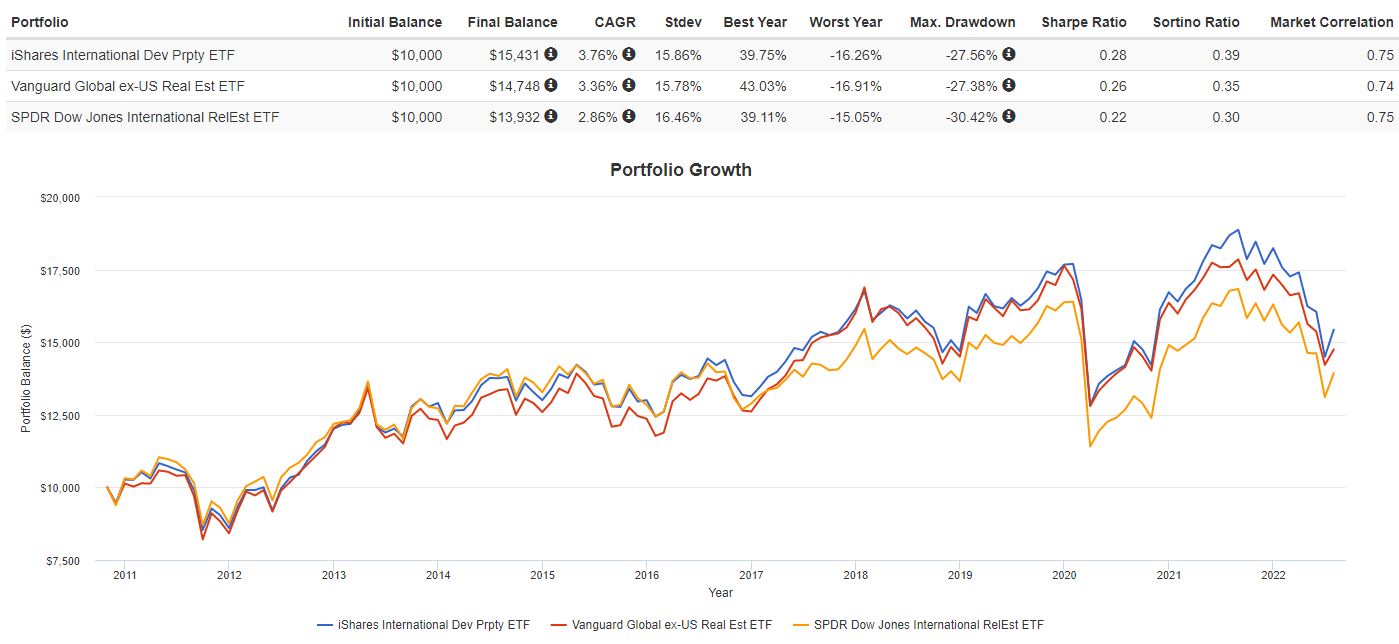
PortfolioVisualizer.com
PortfolioVisualizer.com
Since 2010, WPS has generated 40bps in extra return over VNQI with about the same level of risk. Both the Sharpe and Sortino ratios favor WPS. Both ETFs outperformed RWX. While the following are a snapshot-in-time, it does show how the ETFs differ in some important factors.
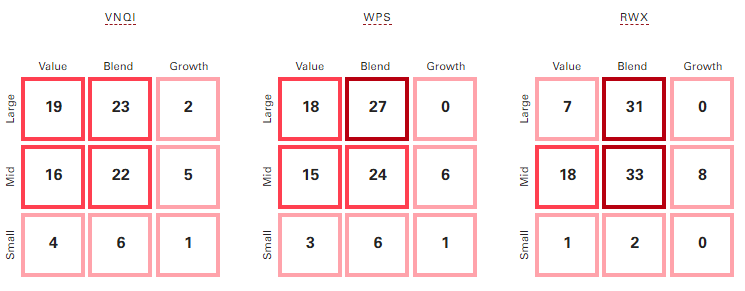
advisors.vanguard.com compare
advisors.vanguard.com compare
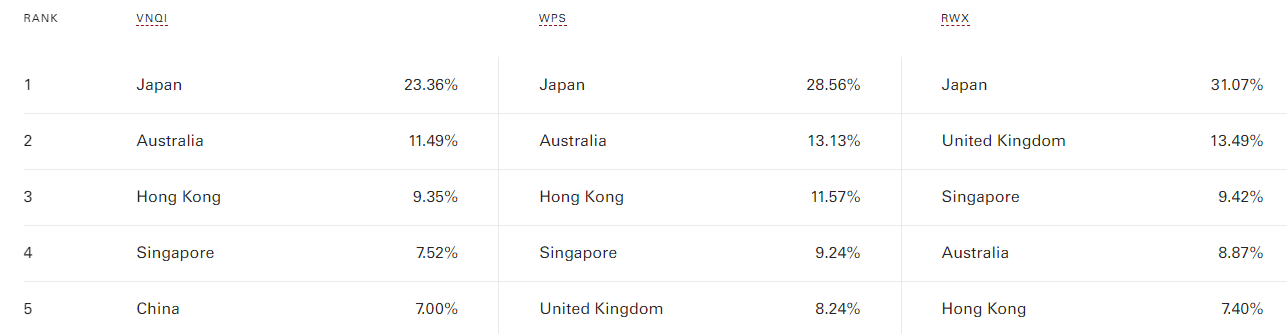
While VNQI and WPS Styles match up well, RWX has more of a Blend weighting and less in Small-Cap REITs than the other two ETFs. The top five countries in each ETF are very similar, except for VNQI’s exposure to China.
advisors.vanguard.com compare
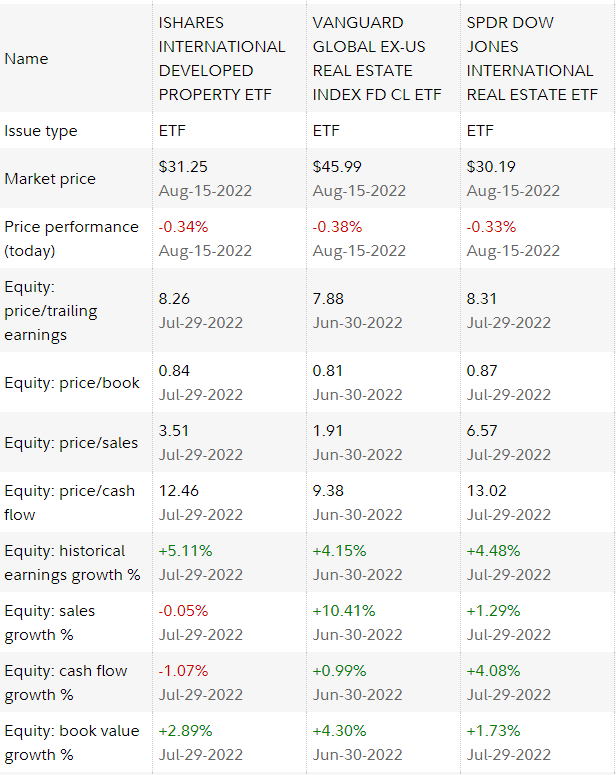
Fidelity.com compare
advisors.vanguard.com compare
Fidelity.com compare
Between WPS (1st set) and VNQI ( 2nd set), most ratios point to VNQI having more of a Value slant on the Price ratios and better ratios that are Growth-oriented. This could explain why VNQI was the best performer of the three over the past year.
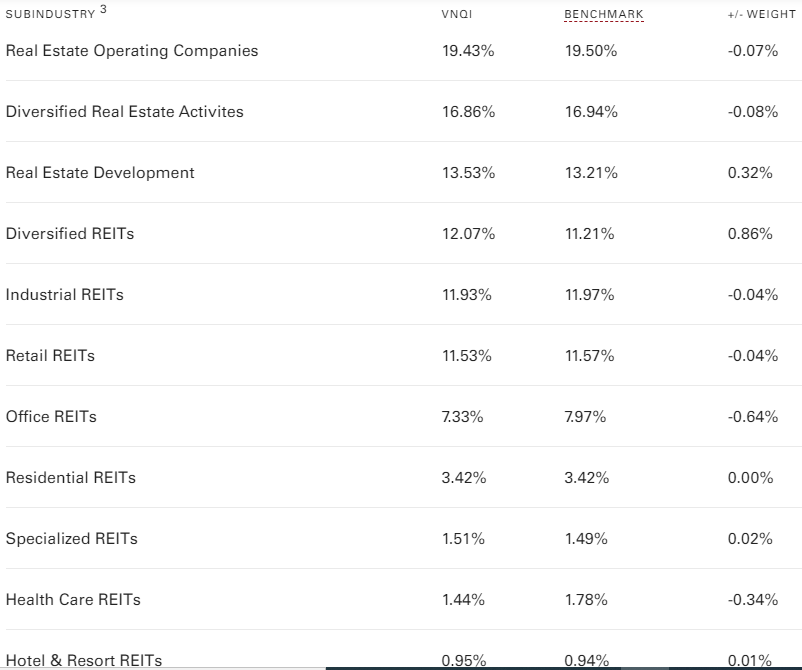
Looking at just WPS and VNQI, the REITs sector allocations match up like this:
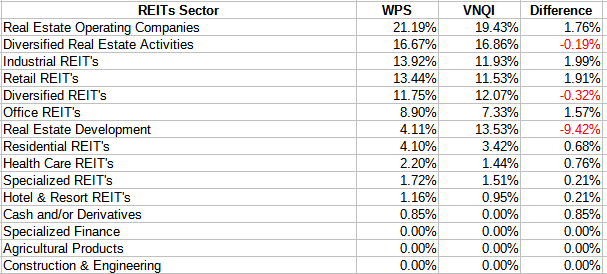
Multiple sources; compiled by Author
Multiple sources; compiled by Author
For this, I chose to ignore the 3% Liquidity Reserve held by VNQI. Most of the other sectors in WPS make up for the large underweight in Real Estate Development. The difference is almost totally due to the inclusion of EM REITs in VNQI, with China being most of that allocation bump.
There are several questions for an investor to reflect upon related to these two ETFs, beyond their relative risk and return results; some being:
Along with the two ETFs reviewed by this article, I added the following to provide data to start the research needed to answer the above questions and maybe others too.
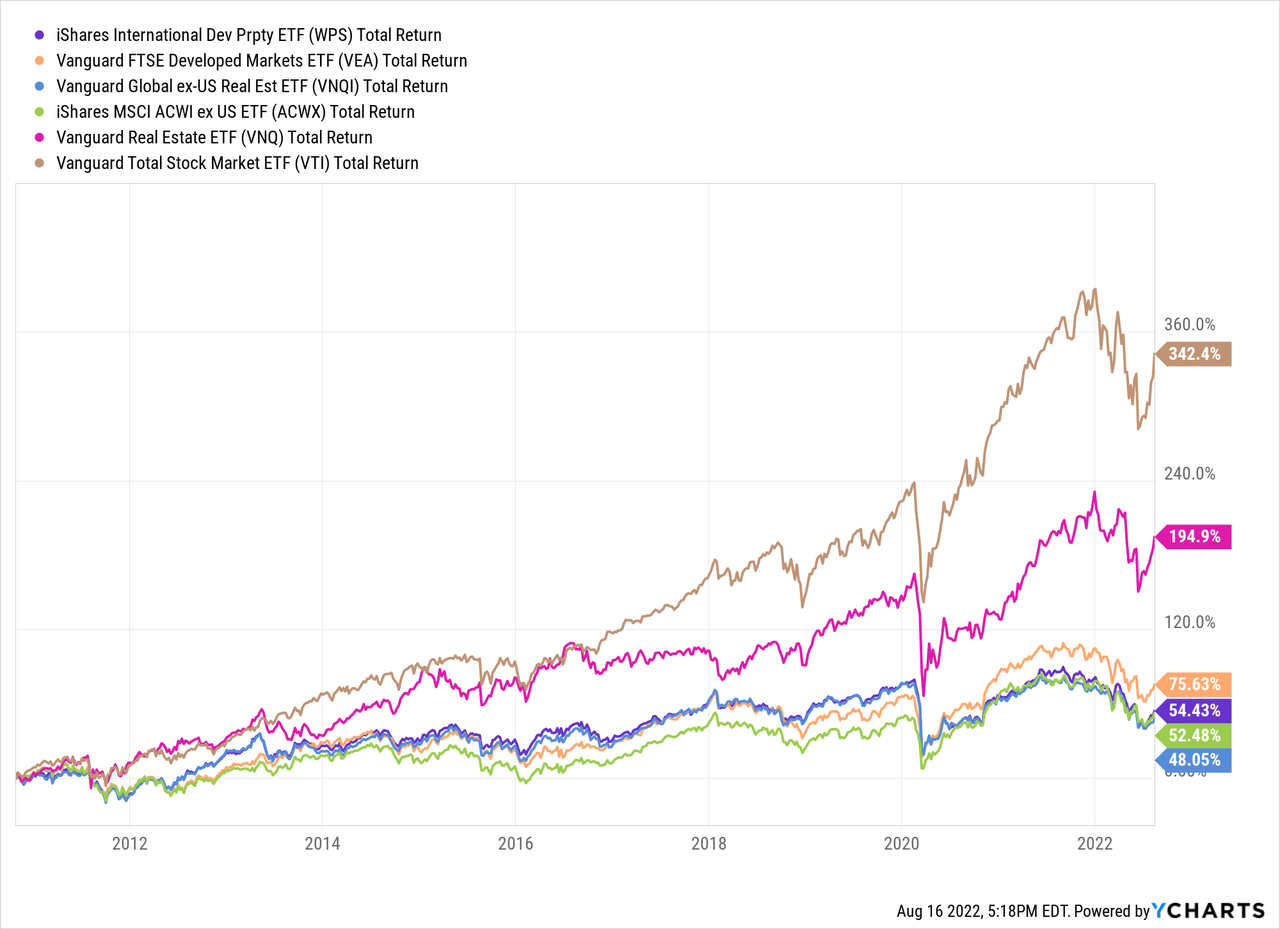
The PortfolioVisualizer data that follows goes back to late 2010 when VNQI started and ends with July’22.
PortfolioVisualizer.com
PortfolioVisualizer.com
The data above aligns with the REIT ETF preceding its Equity ETF counterpart. From this, we get the following information:
So replacing US REITs with international REITs, performance wise, would be a bad move, even for diversity reasons. Between the other ETFs, the iShares International Developed Property ETF has a better CAGR, StdDev, and lower correlation to its international equities counterpart than the Vanguard Global ex-U.S. Real Estate ETF does.
I would give WPS a BUY rating in place of a Total International equity ETF but not the Vanguard FTSE Developed Markets ETF. As VNQI came in last, I would consider replacing it with WPS. 
I ‘m proud to have asked to be one of the original Seeking Alpha Contributors to the 11/21 launch of the Hoya Capital Income Builder Market Place.
This is how HCIB sees its place in the investment universe:
Whether your focus is high yield or dividend growth, we’ve got you covered with high-quality, actionable investment research and an all-encompassing suite of tools and models to help build portfolios that fit your unique investment objectives. Subscribers receive complete access to our investment research – including reports that are never published elsewhere – across our areas of expertise including Equity REITs, Mortgage REITs, Homebuilders, ETFs, Closed-End-Funds, and Preferreds.
This article was written by
I have both a BS and MBA in Finance. I have been individual investor since the early 1980s and have a seven-figure portfolio. I was a data analyst for a pension manager for thirty years until I retired July of 2019. My initial articles related to my experience in prepping for and being in retirement. Now I will comment on our holdings in our various accounts. Most holdings are in CEFs, ETFs, some BDCs and a few REITs. I write Put options for income generation. Contributing author for Hoya Capital Income Builder.
Disclosure: I/we have a beneficial long position in the shares of VTI, ACWX either through stock ownership, options, or other derivatives. I wrote this article myself, and it expresses my own opinions. I am not receiving compensation for it (other than from Seeking Alpha). I have no business relationship with any company whose stock is mentioned in this article.