

mphillips007
mphillips007
This may be the most important article I’m writing this month for one simple reason: homebuilding and the housing market, in general, are driving the stock market. We’re living in a very turbulent time of slowing economic growth, above-average inflation, and a Federal Reserve dedicated to doing everything in its power to get inflation down. In this article, I will give you my view on the housing/homebuilding market using a wide range of economic indicators that should help us to develop a game plan. Not just for the SPDR S&P Homebuilders ETF (NYSEARCA:XHB), which will be the focus of this article, but for everything housing-related.
So, without further ado, let’s get to it!
Also, be prepared to encounter a lot of charts as this is an important topic that needs visual “assistance”.
Housing is important. Everyone knows that. However, how important is housing?
According to the Congressional Research Service:
As of 2020, spending on residential fixed investment was about $885 billion, accounting for about 4.2% of GDP. Second, GDP includes all spending on housing services, which includes renters’ rents and utilities and homeowners’ imputed rent and utility payments. As of 2020, spending on housing services was about $2.8trillion, accounting for 13.3% of GDP. Taken together, spending within the housing market accounted for 17.5% of GDP in 2020.
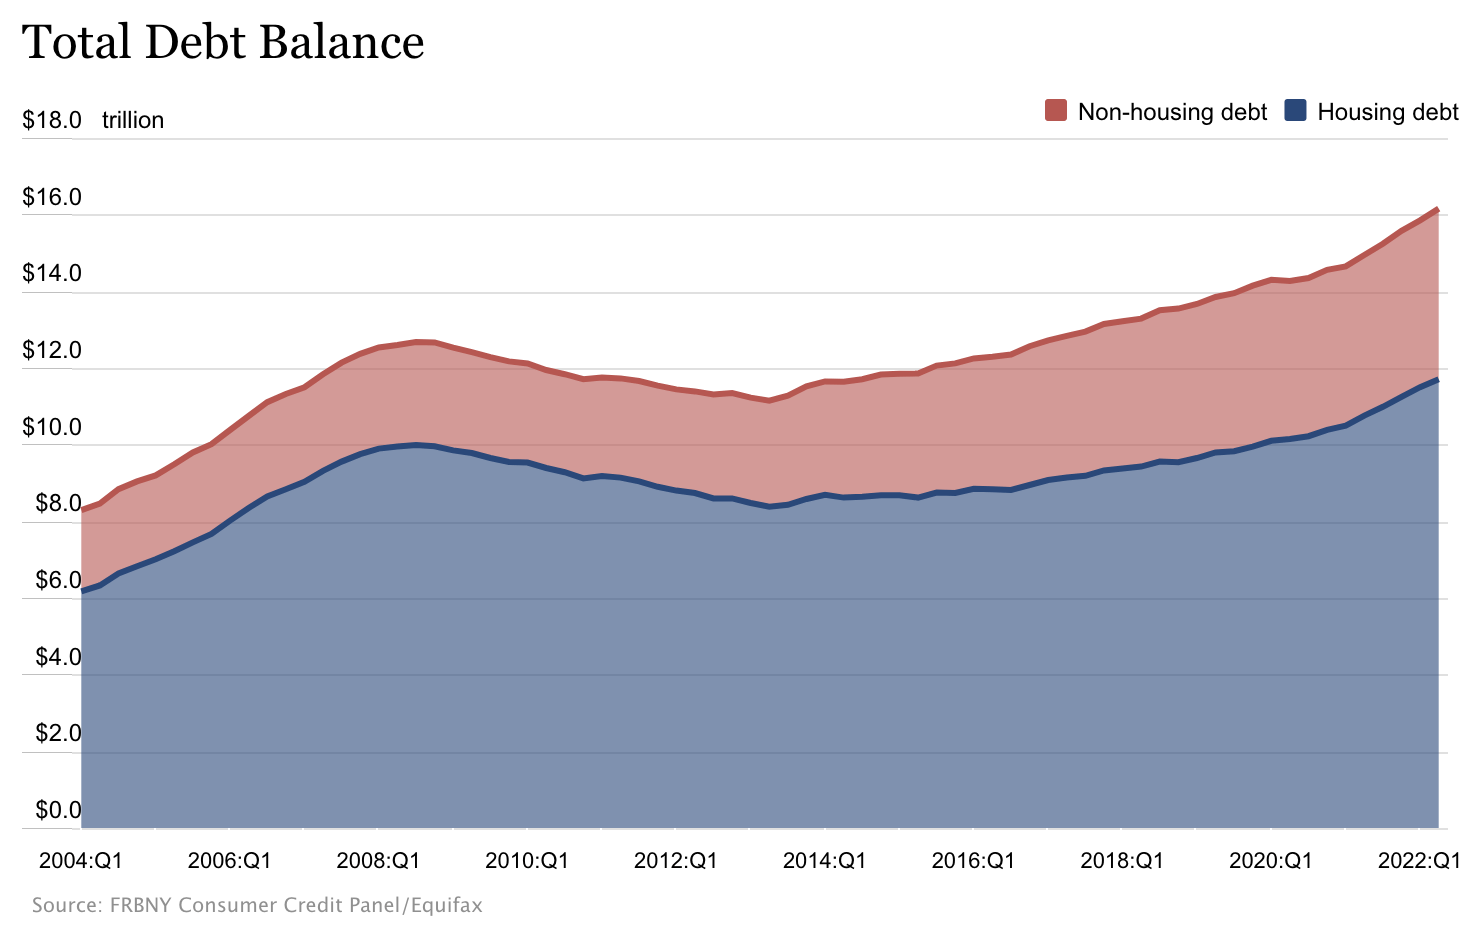
There’s another angle to show how important housing is. In the US, the total housing debt was close to $12 trillion in 1Q22. That’s 72% of total debt according to New York Fed data. Maintaining a strong housing market is important as cracks in the quality of $12 trillion in loans could risk a domino effect as we saw in 2008.
New York Fed
New York Fed
For now, the quality of credit remains fine as the orange line in the chart below shows. Unlike in the prior housing crisis, we’re not seeing a steep increase in delinquencies. For now, that is.

New York Fed
New York Fed
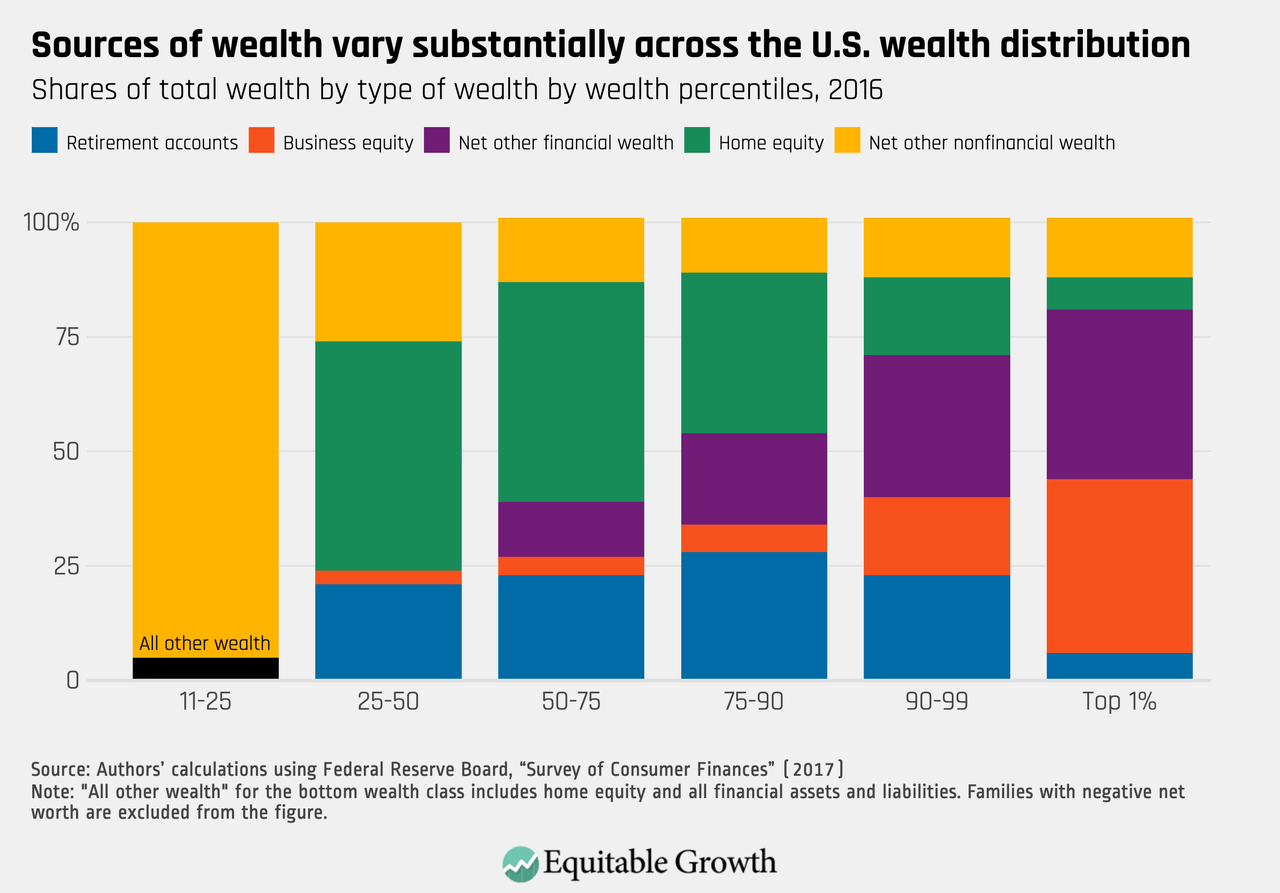
On top of the share of GDP and total debt, housing is a major source of wealth. The chart below is from 2016, but it still gets the message across. Especially middle-class families rely on home equity as the main source of their net worth. The richer people are, the more this shifts to business equity. After all, there’s a limit to the size of a home, but no limit to the wealth someone can accumulate.
Equitable Growth
Equitable Growth
In other words, housing is important for the nation’s GDP, debt quality, and stability of the financial system, as well as people’s net worth.
This week, I spent a lot of time throwing housing-related charts at my Twitter followers as I was working my way through every important piece of data.
In preparation for this article, I did a thread that contained the latest NAHB housing market data.
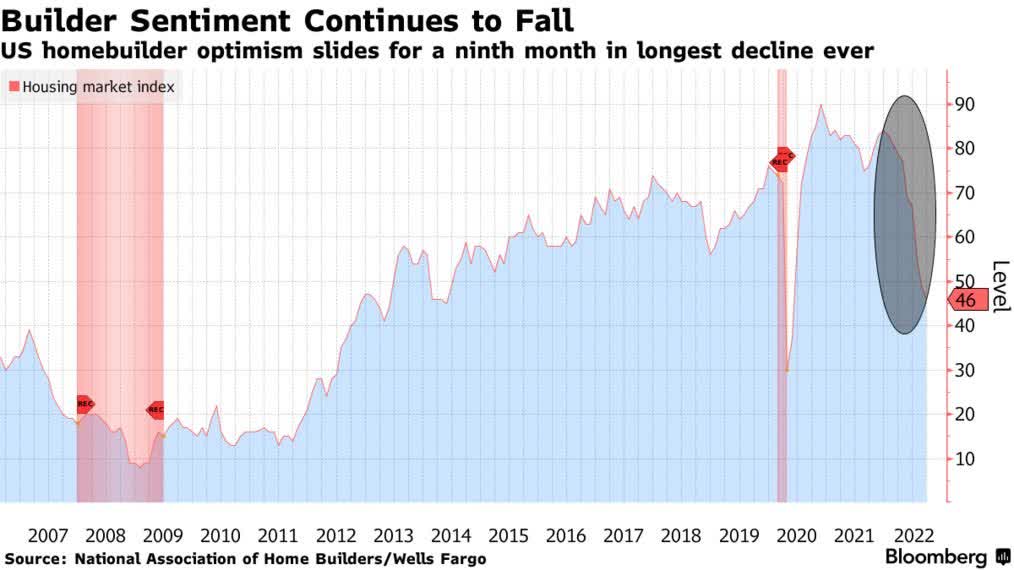
The famous NAHB homebuilder index fell to 46. It was 49 in July and expected to fall by only one point. This is now the longest decline ever, although that doesn’t mean as much as sentiment in 2008 was much lower.
Bloomberg
Bloomberg
Yet, there’s no denying that these numbers are bad. The sentiment is now well-below any levels seen during the years after 2013 when the demand side came back, prices rose, and the Fed wasn’t as aggressive.
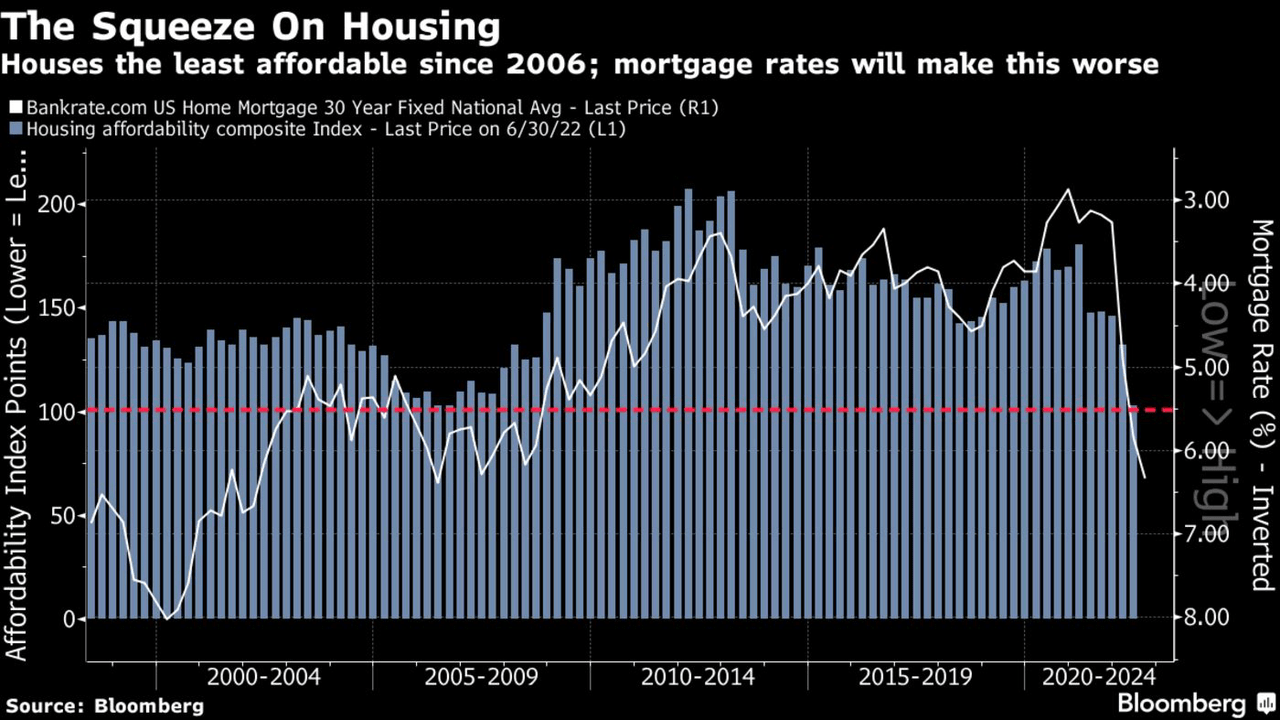
Essentially, the NAHB blames high mortgage rates and high home prices, which is a very toxic mix for new buyers. Home affordability has cratered to levels not seen since the Great Financial Crisis as the chart below shows. It comes at a time when mortgage rates have breached the 6% mark as the chart below also shows (inverted).
Bloomberg
Bloomberg
On top of that, we’re still dealing with supply issues, which makes it hard for homebuilders to create new homes. According to the NAHB:
“Builder sentiment has declined every month in 2022, and the housing recession shows no signs of abating as builders continue to grapple with elevated construction costs and an aggressive monetary policy from the Federal Reserve that helped pushed mortgage rates above 6%[…]”
“In this soft market, more than half of the builders in our survey reported using incentives to bolster sales, including mortgage rate buydowns, free amenities and price reductions.”
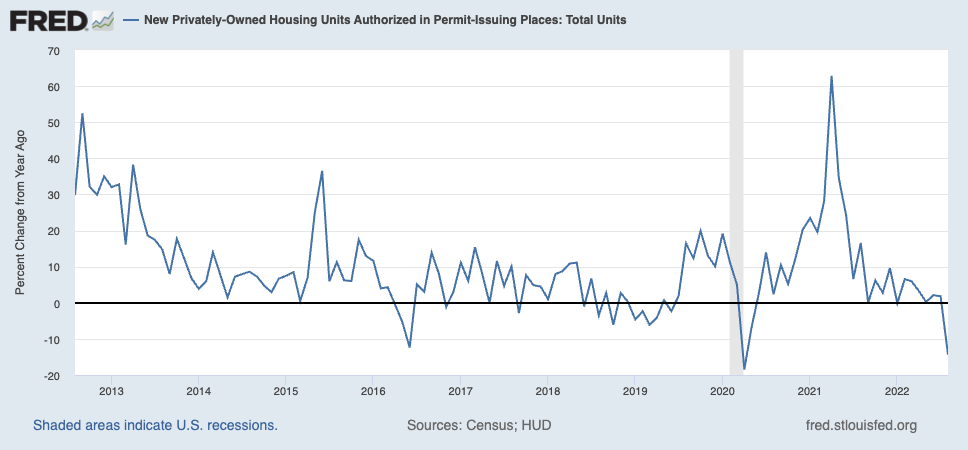
As a result, building permits are imploding. In August, building permits were down more than 14%, which will impact homebuilders’ top line in the quarters ahead as building permits tend to guide new orders(!).
St. Louis Federal Reserve
St. Louis Federal Reserve
Believe it or not, these developments are actually good news for the Fed. It shows its actions are having a real impact on America’s financial heart, so to speak.
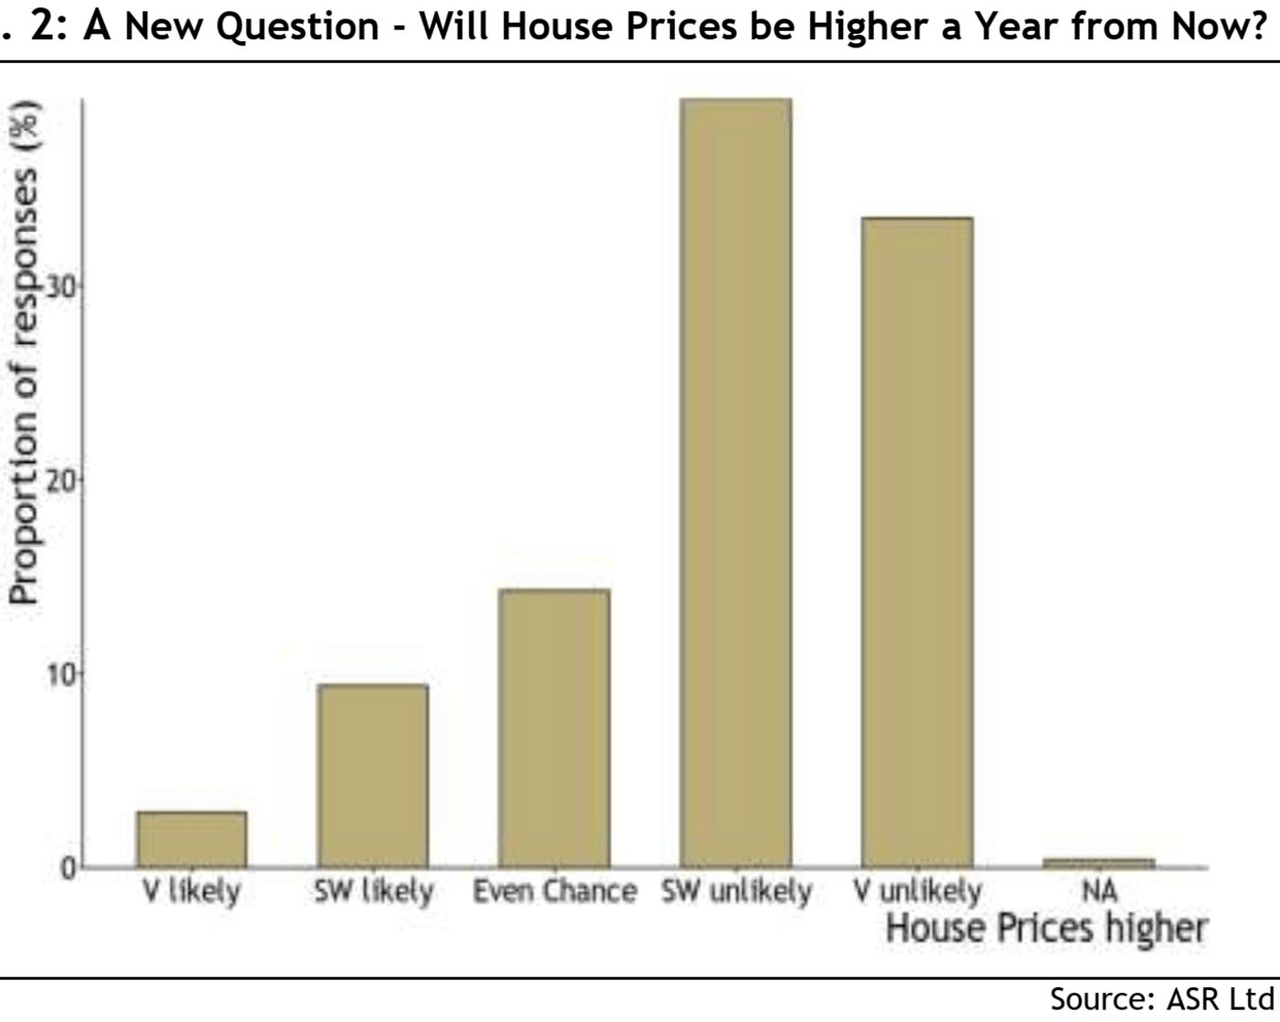
Market participants do not expect good times to be over according to the Absolute Strategy Research surveys of investors. A huge majority believe it is somewhat or very unlikely that home prices will be up a year from now.
ASR Ltd
ASR Ltd
It also needs to be said that a lot of homebuilders with fixed mortgage rates have rates much lower than current rates, which is causing them to stay put, adding further pressure to weakening home sales.
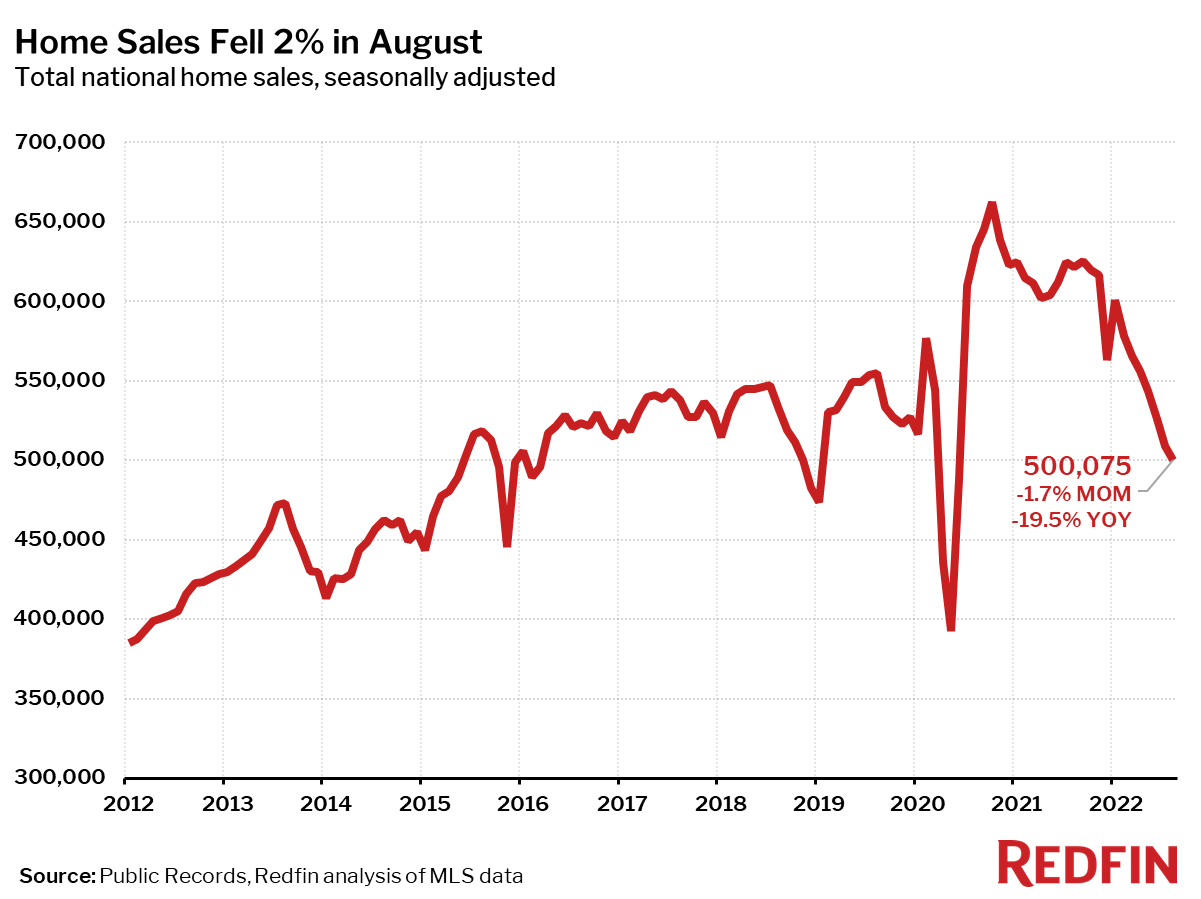
Home sales are down 2% in August versus July. Sales are down 20% compared to August 2021. That’s a big deal as it erases the entire buying frenzy after the pandemic drove people out of major cities.
Redfin
Redfin
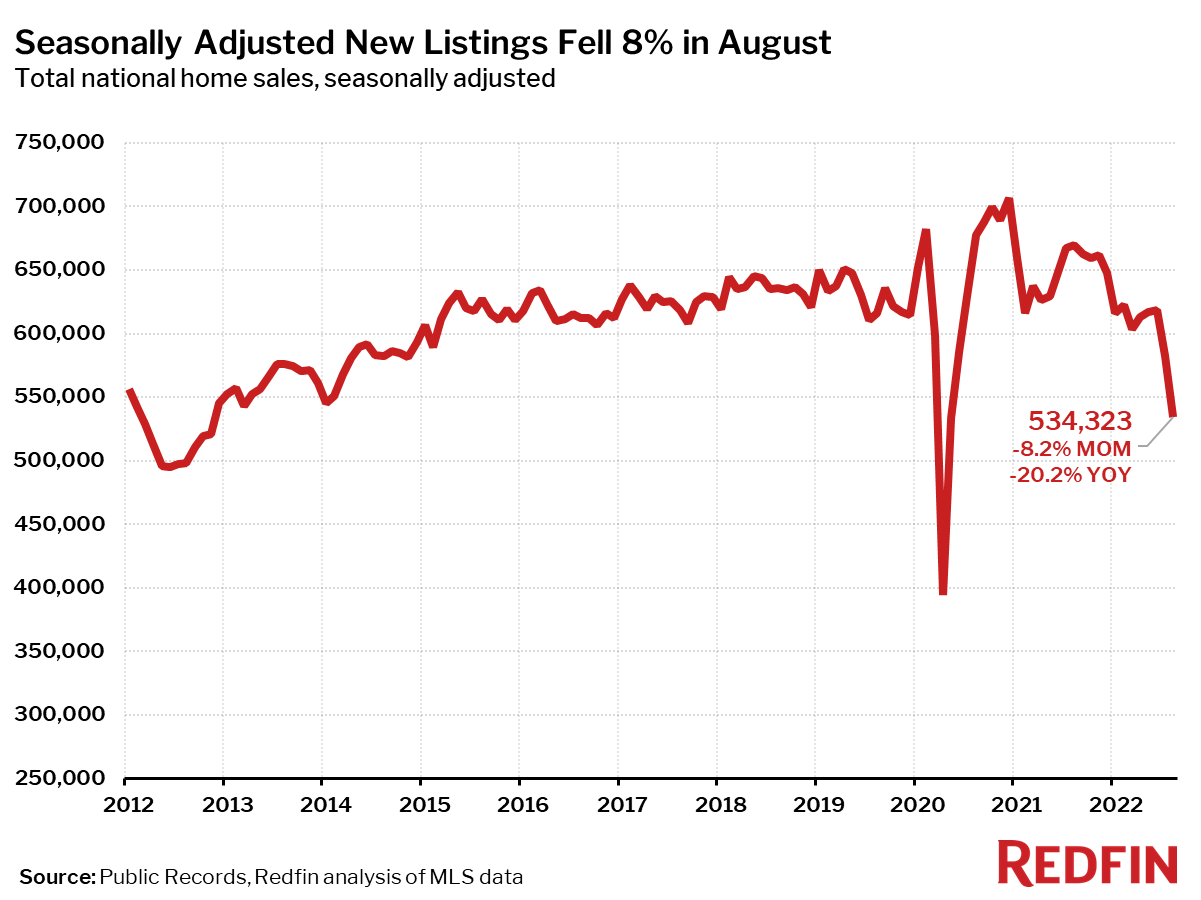
As it is (slowly but steadily) becoming a buyers’ market, home listings are nosediving, falling 20% versus August 2021.
Redfin
Redfin
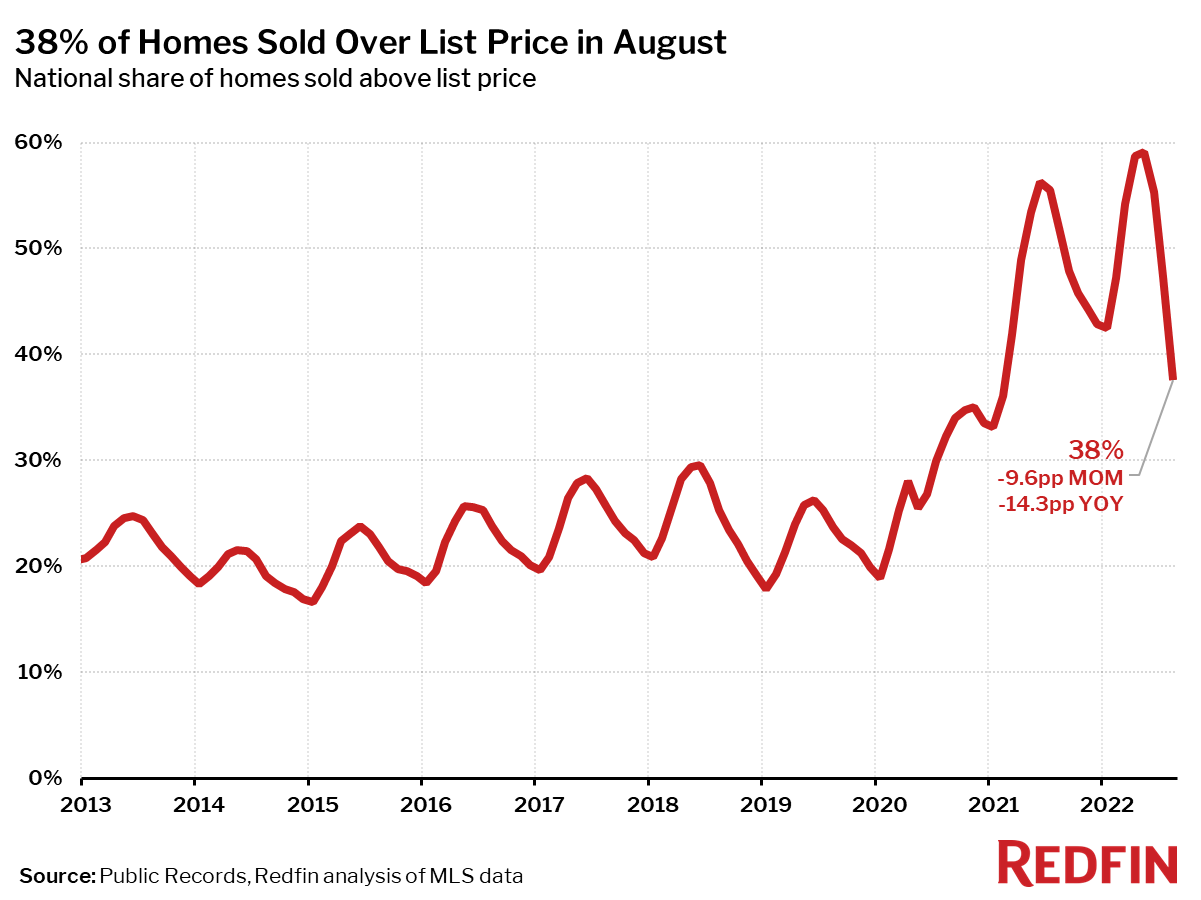
To give you one more Redfin chart, only 38% of homes were sold over the list price. That’s still elevated versus pre-pandemic levels, but the trend is clearly down and gaining momentum as bidding wars are ending quickly.
Redfin
Redfin
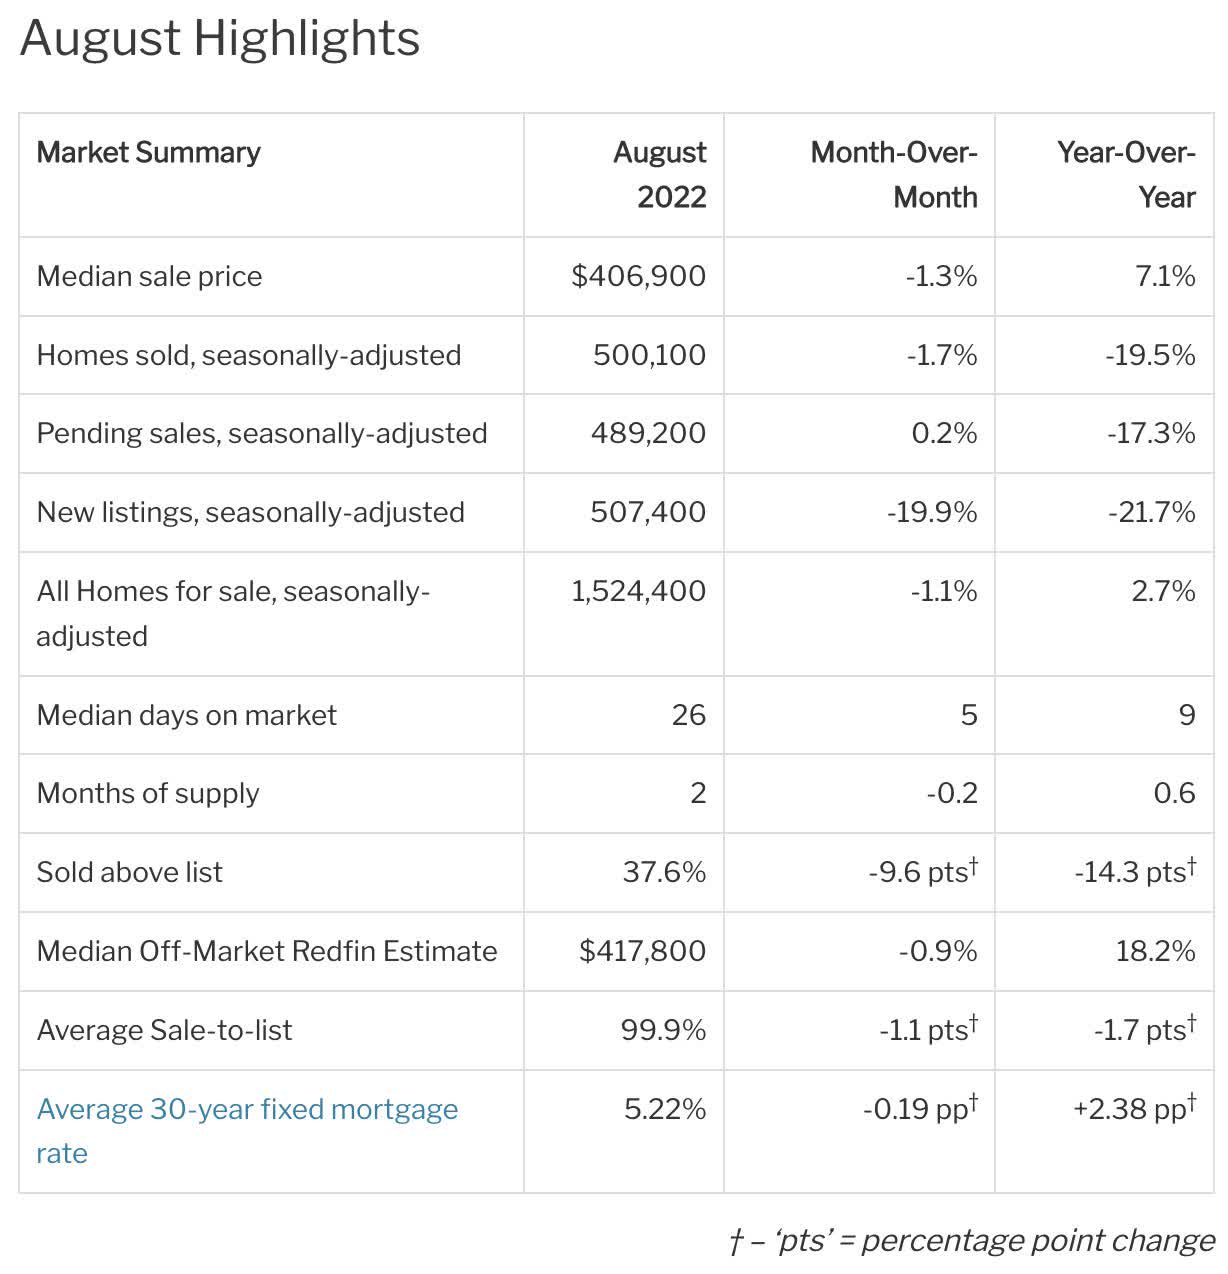
Looking at the bigger picture (the table below), we see that prices are still elevated. The median sales price is up versus prior-year levels while home sales, pending home sales, new listings, and “bidding wars” are all imploding. I believe it is just a matter of time until pricing comes down as well unless the Fed suddenly does a U-turn to stimulate the economy. That’s unlikely as it would guarantee that inflation starts to rise from already elevated levels, but I wanted to mention it anyway.
Redfin
Redfin
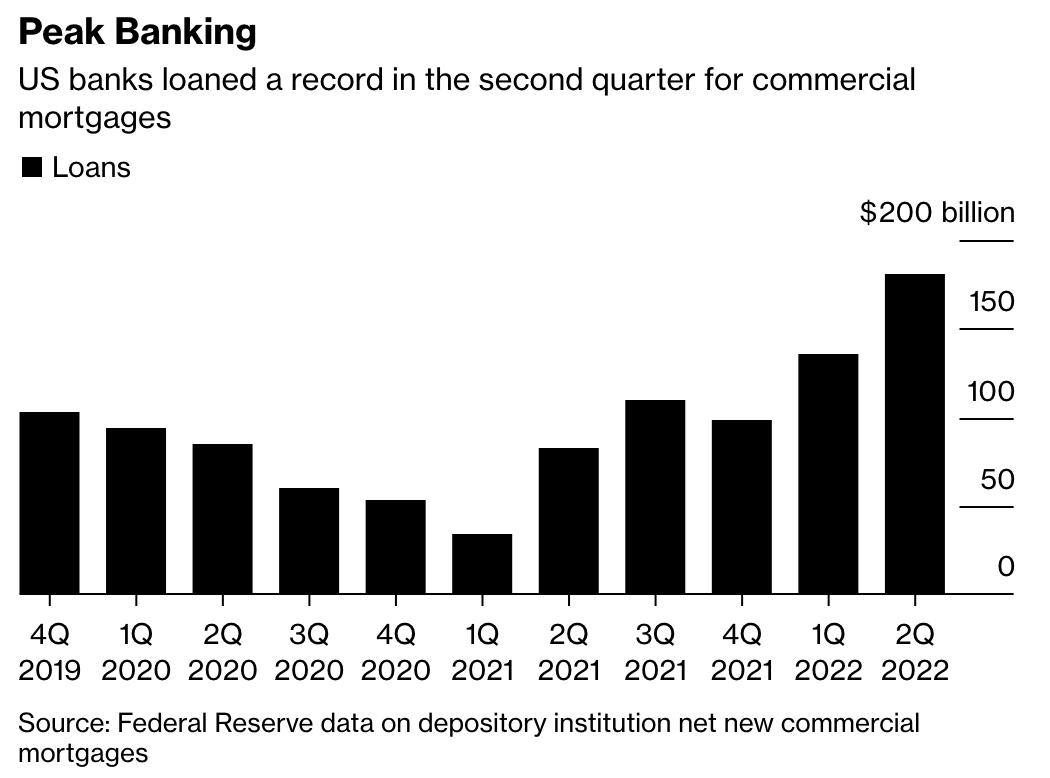
With regard to my “prices will come down” comment, major US banks are now starting to reduce lending.
In the first six months through June, US-regulated banks financed a record $316 million of new commercial real estate loans. That’s a 172% increase versus the same period in 2021. Higher rates were the main driver behind this increase. The graph below shows this steep increase.
Bloomberg
Bloomberg
Now, the tide is turning as Bloomberg reports. The biggest banks are now expected to reduce lending by 50% in the second half – compared to the first half.
That pullback is partially due to weaker client demand, as well as concerns about the surge in interest rates. In some cases, heightened regulatory oversight has played a role.
“A couple of the big money-center banks have been asked to pull back from their commercial real estate lending, specifically on office,” Brock Cannon, head of national loan sales for Newmark Group Inc., a commercial real estate brokerage. “The government is trying to get their arms around everything to see how impactful this is going to be; how severe will the losses be.”
Especially the last sentence is key. The government will need to see how severe potential losses are. After all, hurting demand in order to pressure inflation comes with significant risks. Breaking the housing market will get inflation down, but at what cost?
Homebuilders are starting to adapt to a new housing environment after benefiting from an accelerating backlog for roughly two years.
The XHB ETF (more details on this ETF in this article) peaked in December of 2021 a few months after mortgage rates bottomed (inverted in the chart below). Homebuilders started to gain downside momentum as soon as rates started to surge. Year-to-date, the ETF is down 33%, which is more or less equal to the max drawdown from its 52-week high.
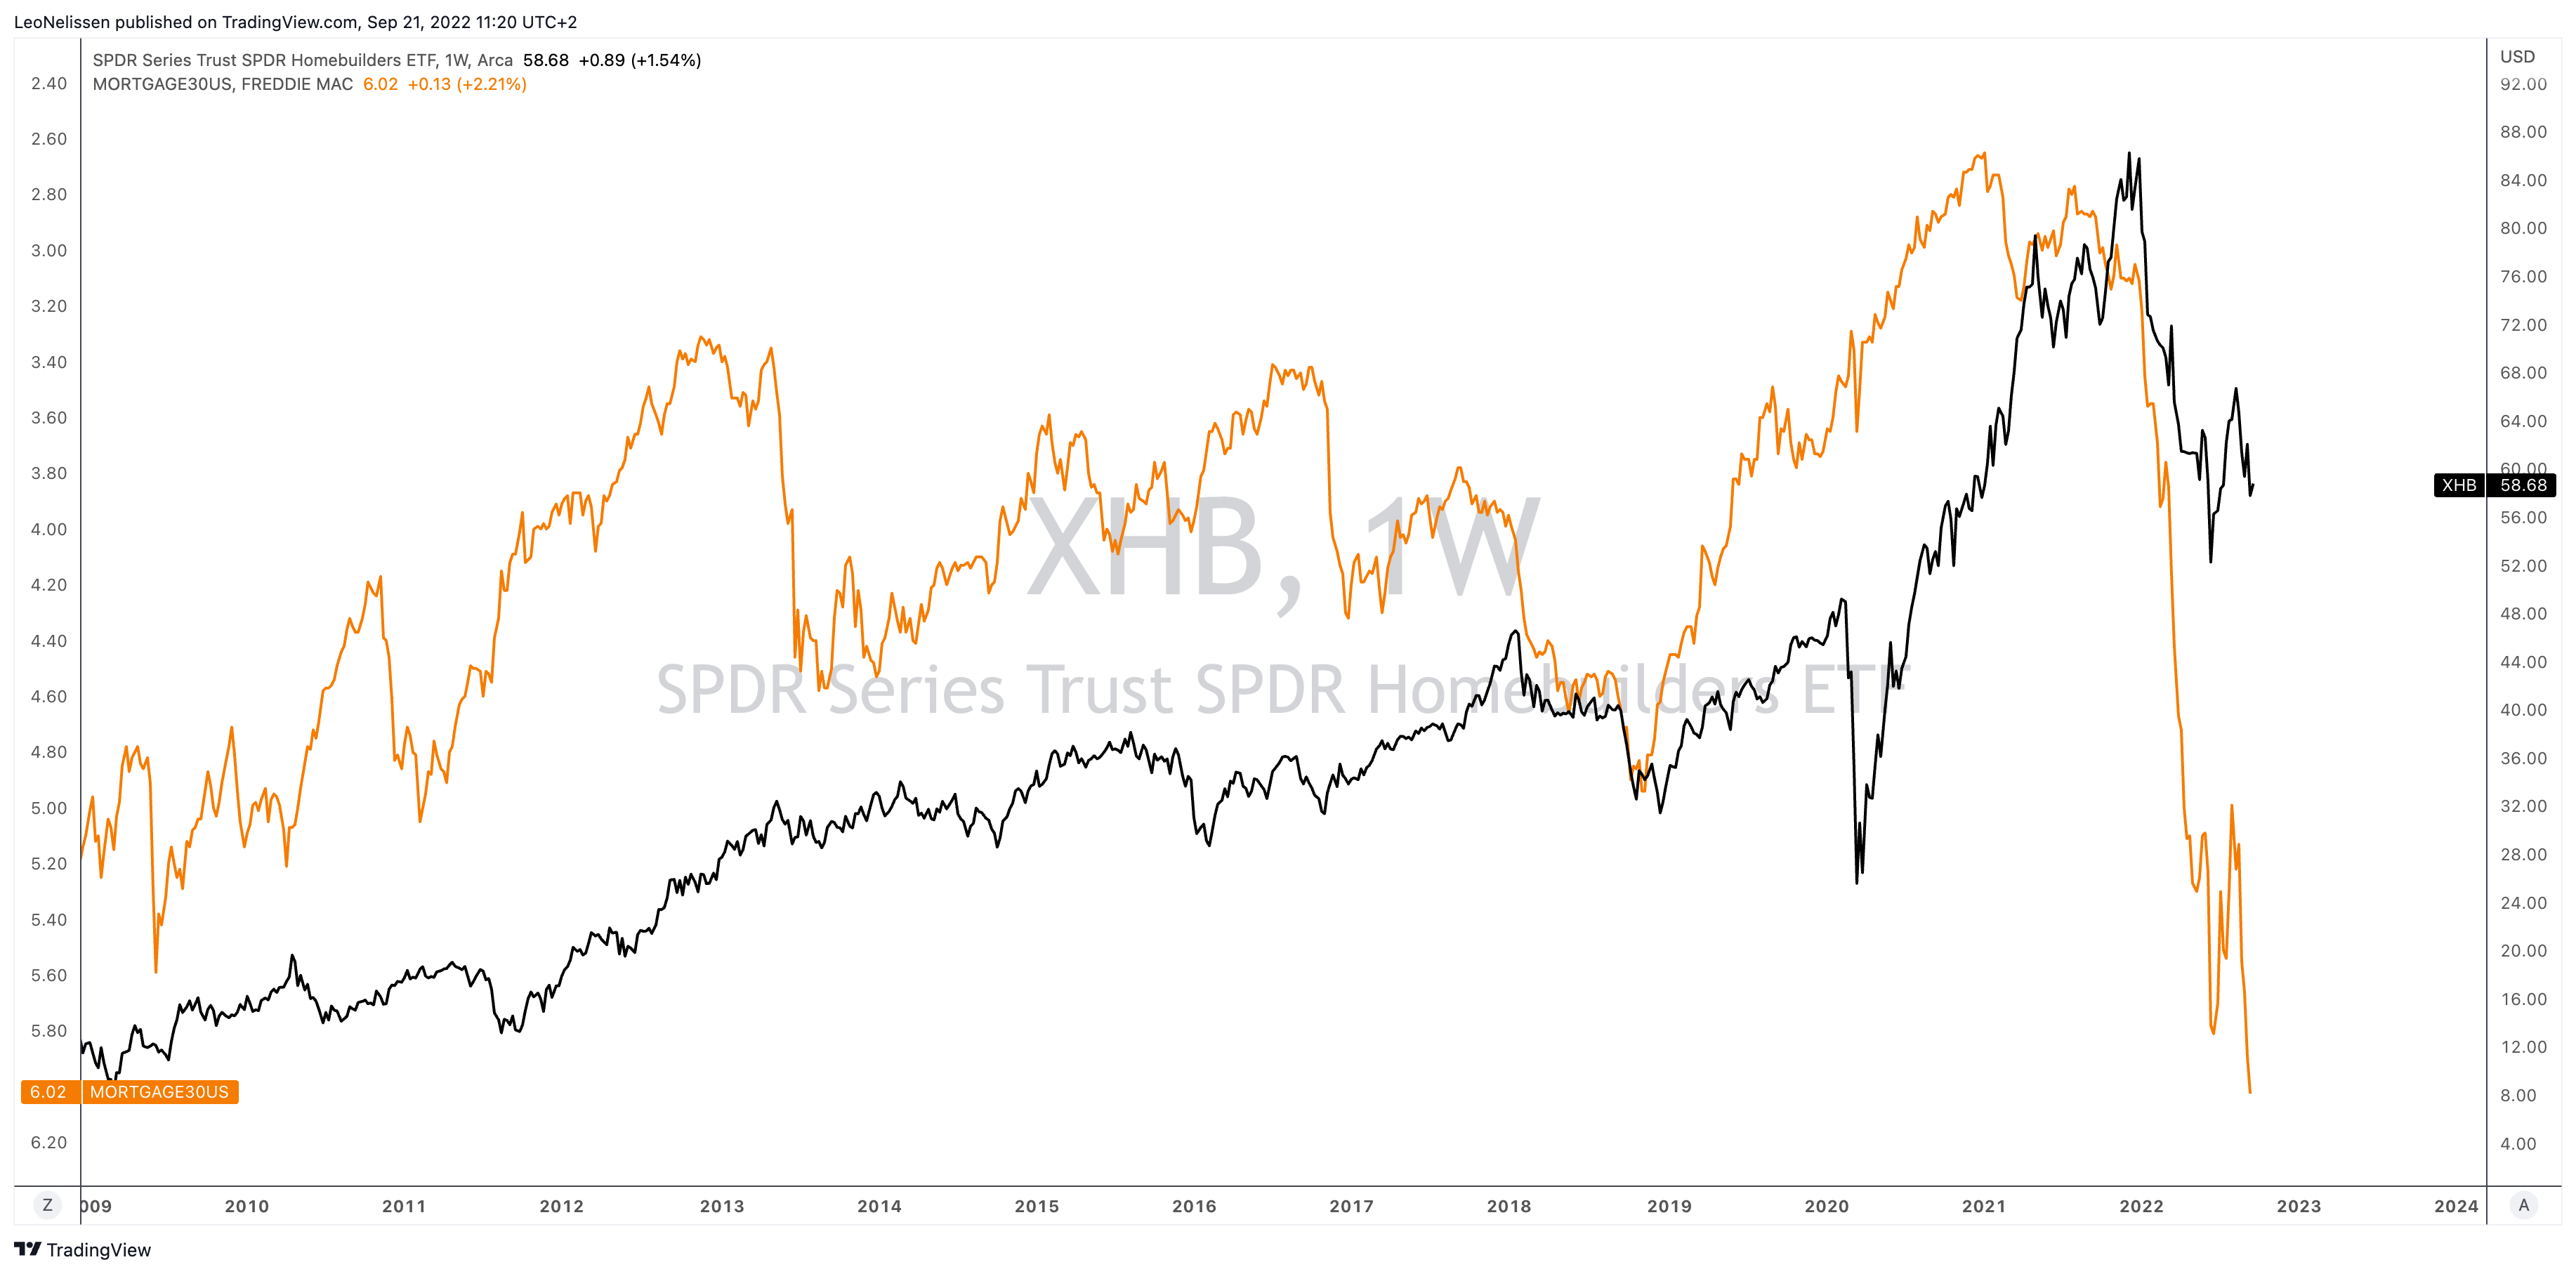
TradingView (Black = XHB, Orange = 30Y Mortgage Rates)
TradingView (Black = XHB, Orange = 30Y Mortgage Rates)
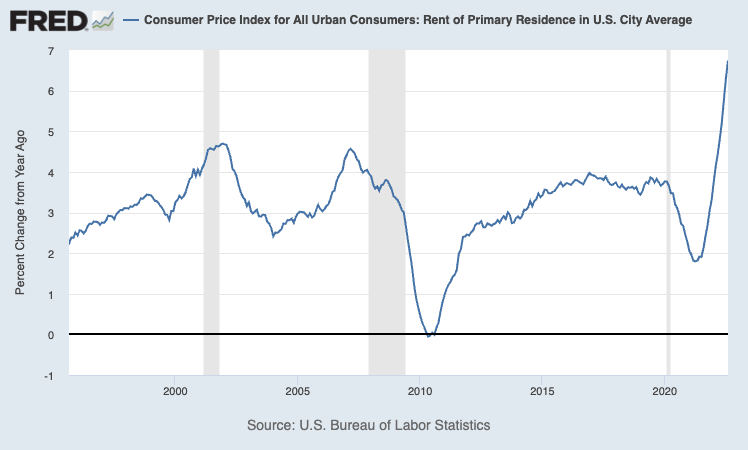
As single-family demand is fading, homebuilders are shifting to multi-family homes. That’s based on rental demand. As homeowners encounter housing weaknesses, they are much more likely to turn their properties into rental assets. This will increase rental supply and it could help the Fed to get inflation under control as rental inflation has become a big issue as the chart below shows.
St. Louis Federal Reserve
St. Louis Federal Reserve
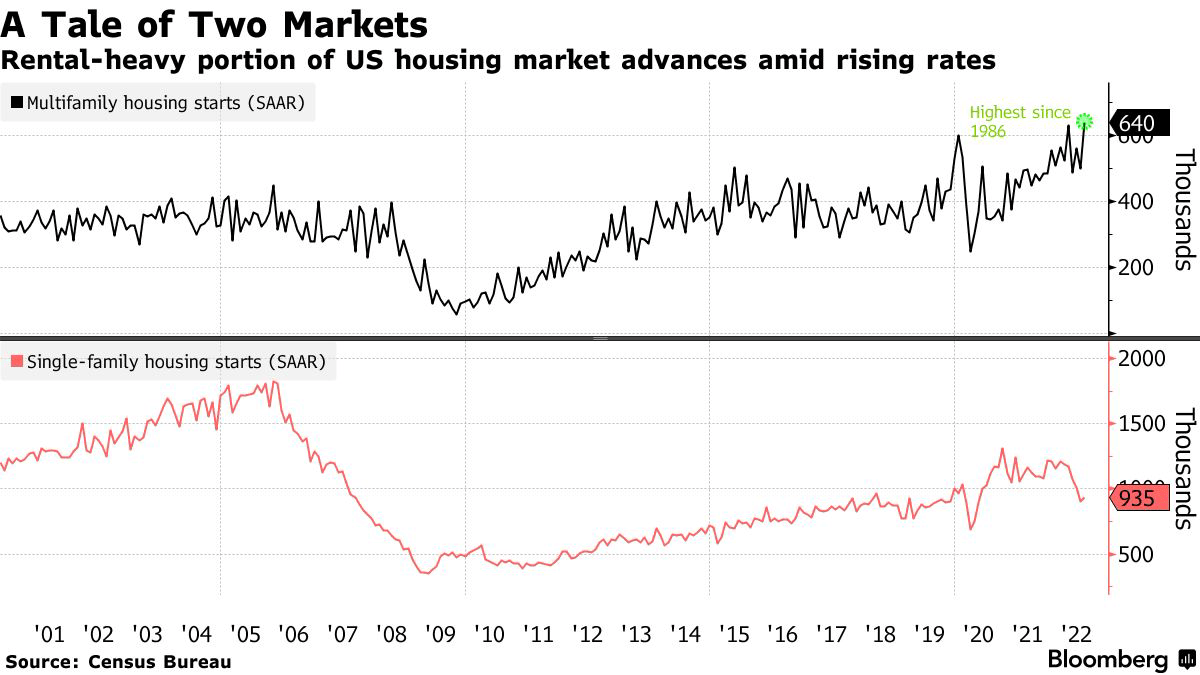
While SFH starts have slowed dramatically, multi-family housing starts have increased. While I believe that both will further weaken if the Fed doesn’t take the foot off the brake, I believe this is a good indication of a shift from buying to renting. After all, the surge in mortgage rates is also making renting more attractive in certain areas of the US.
Bloomberg
Bloomberg
According to industry insiders:
“Low apartment vacancy rates and a structural shortfall of single-family homes have bolstered multifamily construction,” Wells Fargo & Co. economists Charlie Dougherty and Patrick Barley said in a note.
“Some moderation in multifamily construction is likely ahead as rising rents and broad inflation pressures lead to a moderation in apartment demand compared to last year’s record pace,” they said.
Essentially, XHB has become a trading vehicle. Homebuilders are expected to do well the moment the Federal Reserve pivots. In the current situation of above-average inflation, slowing economic growth, and an eager Fed, there isn’t much hope that buyers return.
The XHB ETF has been on my radar for many years. I’ve covered it a lot in the past for one major reason: it allows buyers to buy diversified homebuilding exposure without having to dive into single homebuilders.
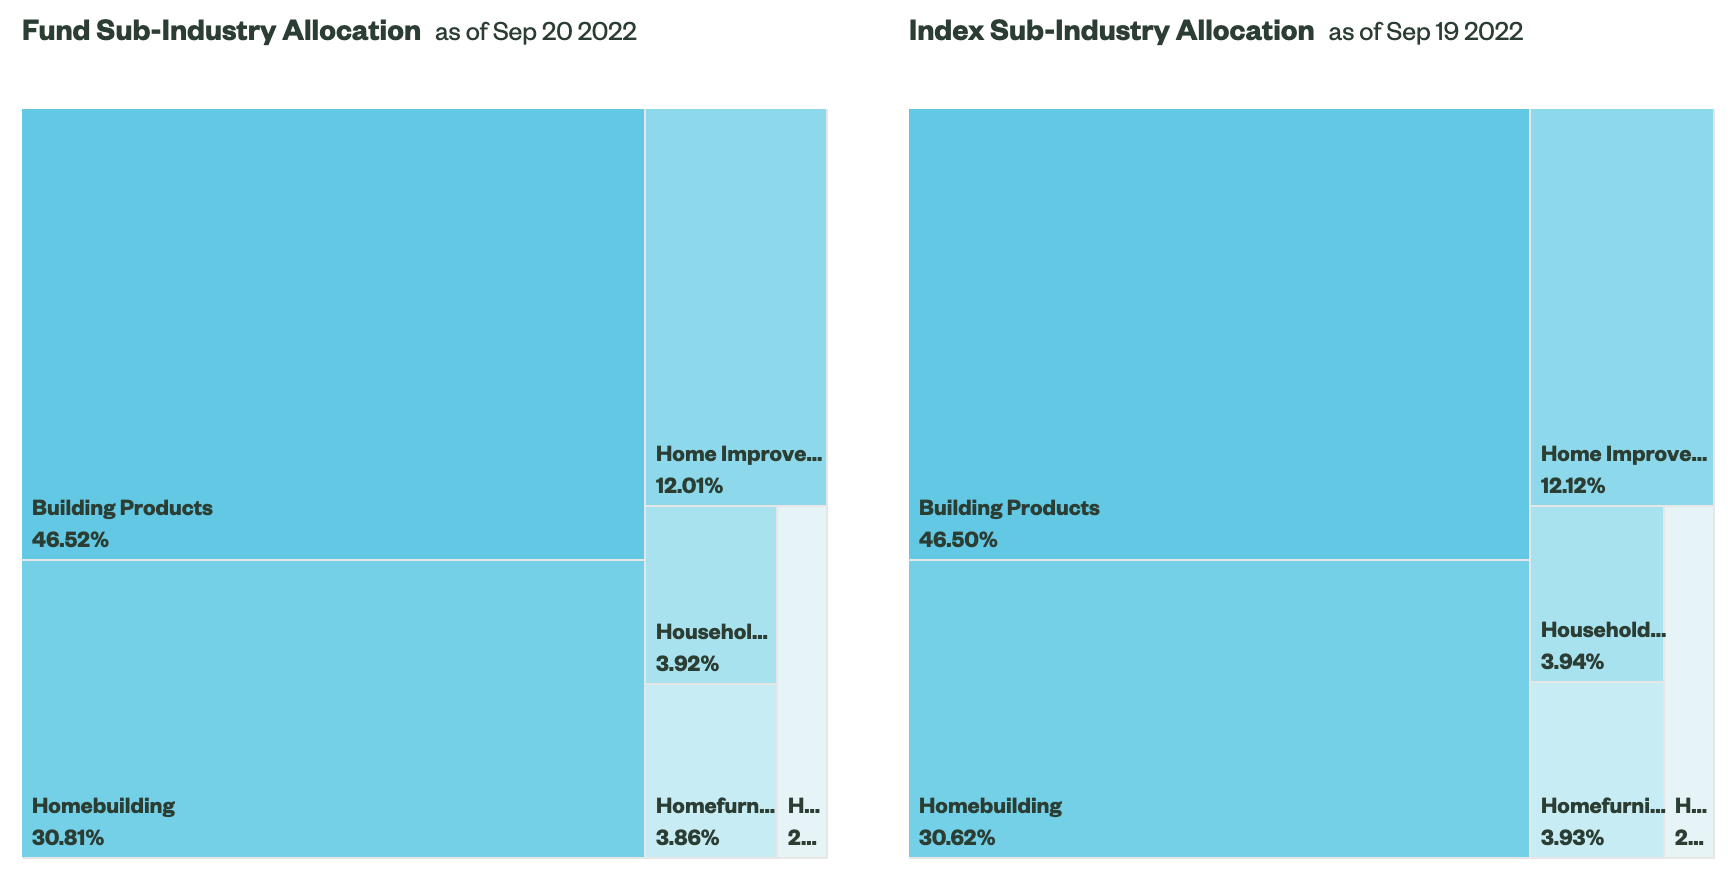
Moreover, XHB isn’t just homebuilding. According to State Street (the owner of the ETF):
[The ETF] Seeks to provide exposure to the homebuilders segment of the S&P TMI, which comprises the following sub-industries: Home Building, and may include Building Products, Home Furnishings, Home Improvement Retail, Homefurnishing Retail, and Household Appliances.
“Pure-play” homebuilders account for “only” 31% of the ETF.
State Street (XHB Breakdown)
State Street (XHB Breakdown)
Moreover, this ETF has $830 million in assets under management, which makes it everything except a small ETF.
The expense ratio is 0.35%, which is fair given that we’re dealing with a niche ETF that doesn’t have competition. At least not from well-diversified building ETFs with similar assets.
Going back to the portfolio, the ETF has 35 holdings with a weighted average market cap of $28 billion. The 30-day SEC yield (dividend yield) is slightly above 1.0%, which I’m just mentioning as a formality. I do not at all believe that XHB is a dividend-income tool.
It also helps that no holding has a weighting of more than 4.3% in the ETF. Even number 10 still has a 4% weighting. The largest 3 holdings are all homebuilders. However, the top 10 also include well-known DIY stores like Home Depot (HD) and Lowe’s Companies (LOW).
I own Home Depot, and it’s one of the companies I’m keeping a very close eye on as my strategy is not to short anything down to lower prices, but to buy quality housing exposure as soon as the Fed hints at a pivot.
Home Depot is one of the stocks on my watchlist. However, I’m also looking at Extra Space Storage (EXR), which will be a great addition to my Public Storage (PSA) investment as well as railroads like Union Pacific (UNP) and Norfolk Southern (NSC) that are major transporters of building materials.
Or, if you’re looking for single-family income, you may like Invitation Homes (INVH), which I recently covered.
So, while I am not actively trading or investing in XHB, I do use it as a benchmark for homebuilders and housing, in general.
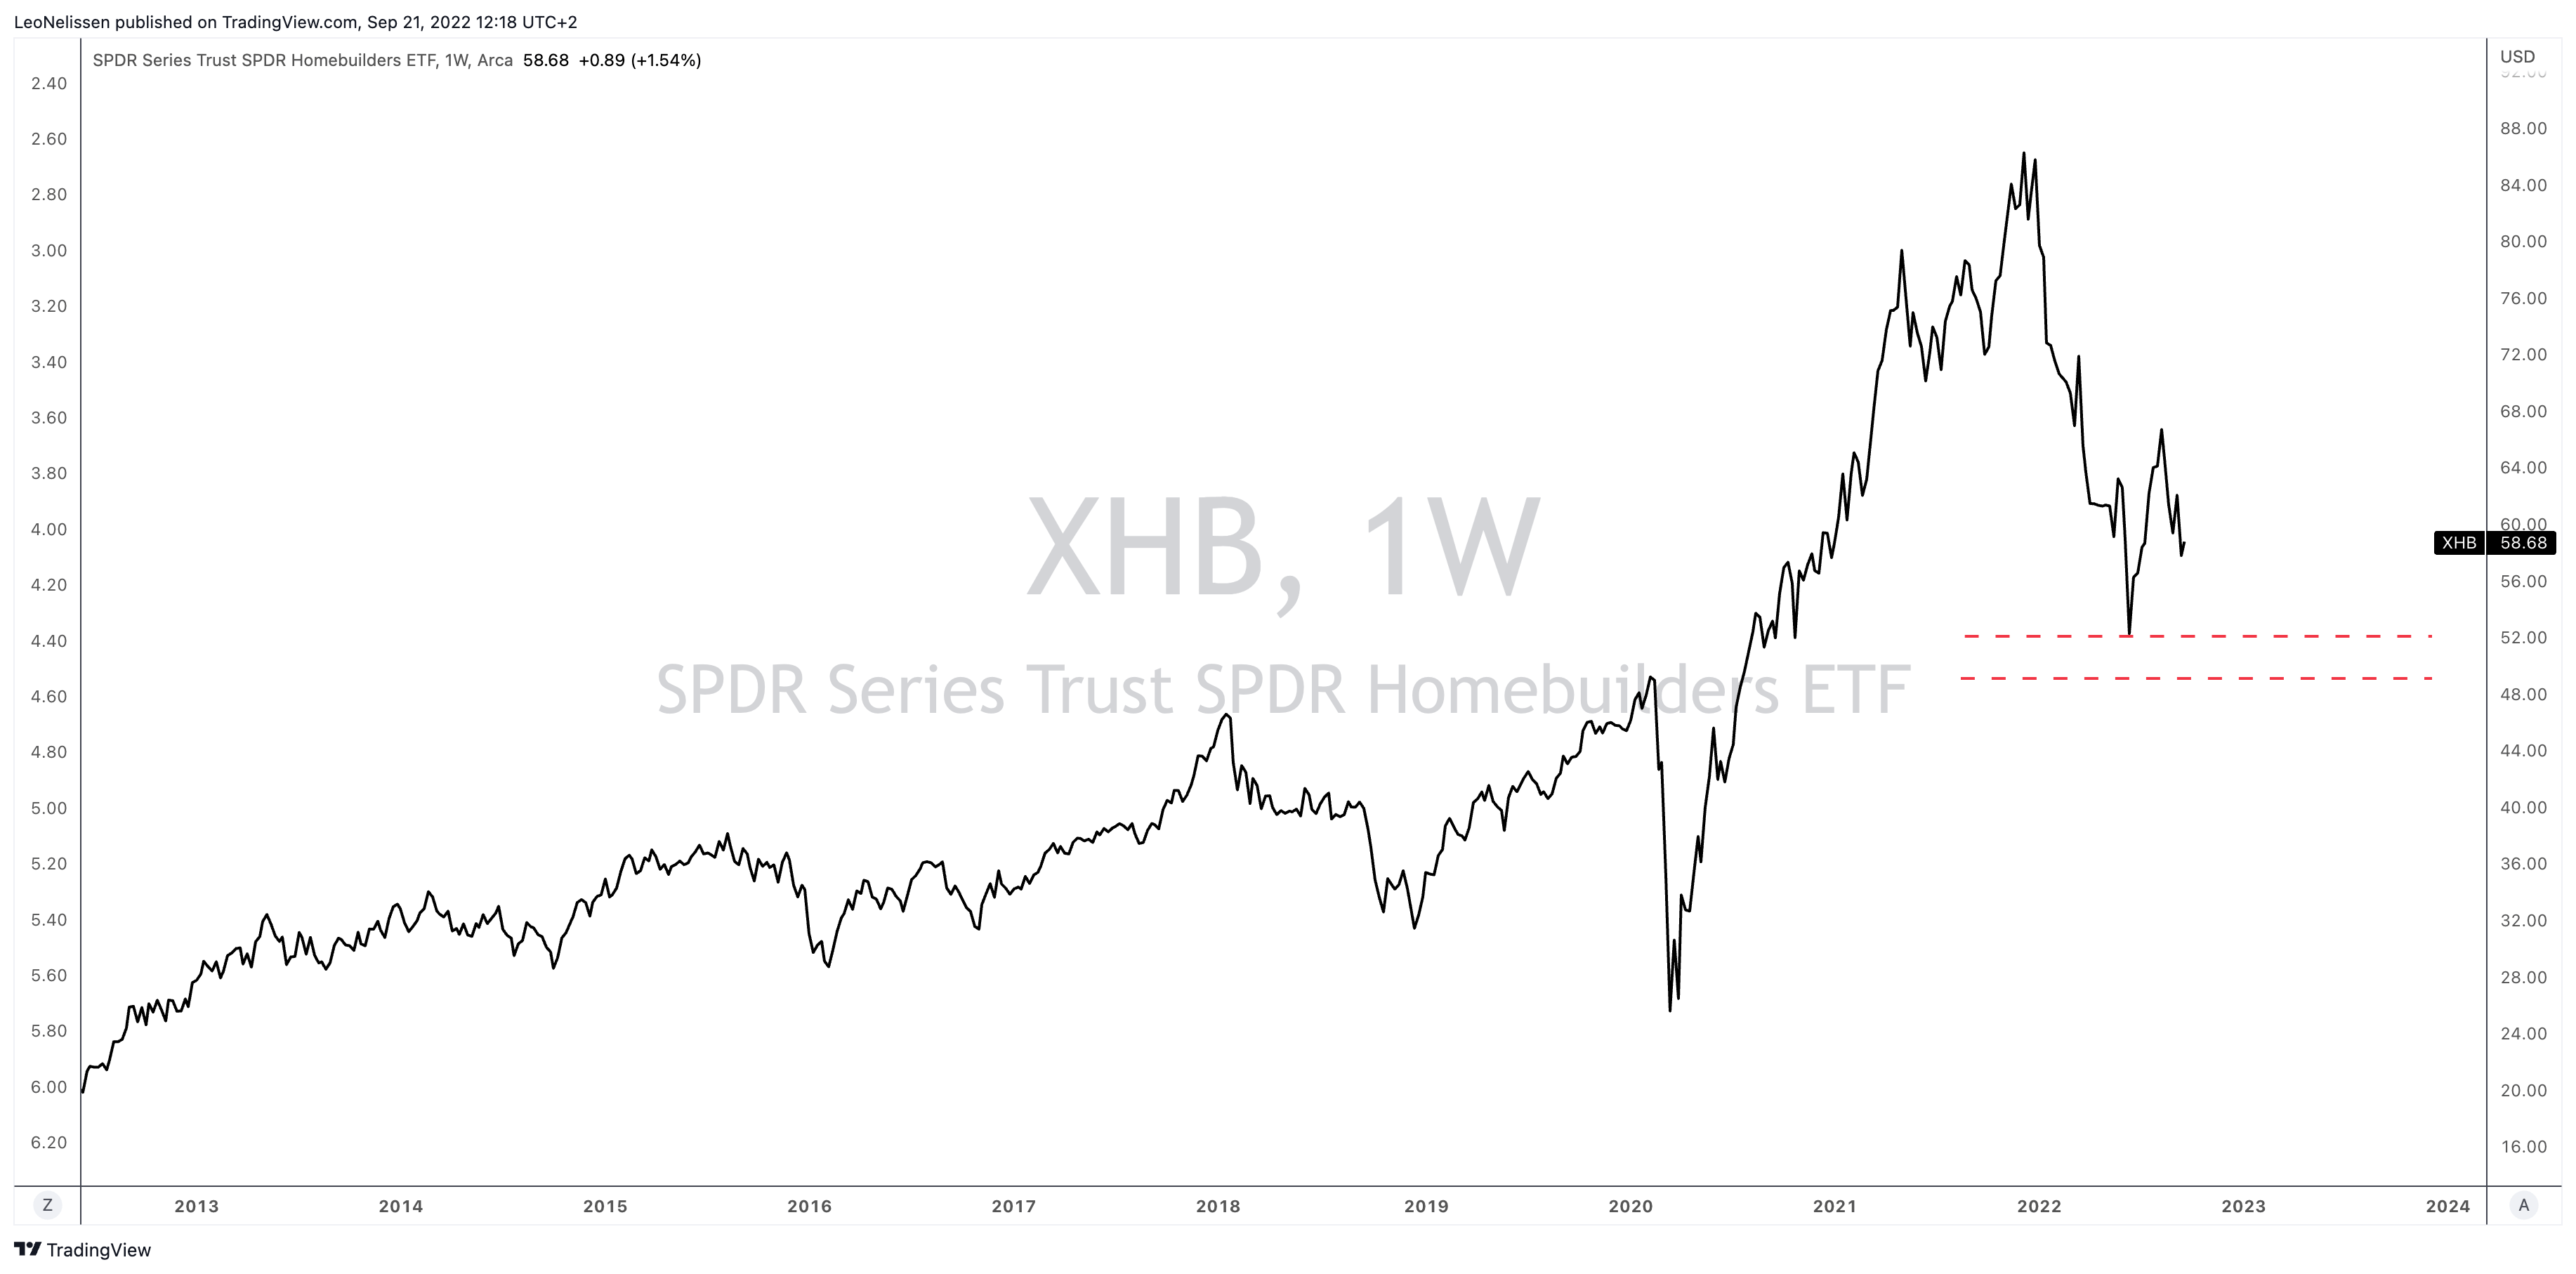
Given the situation, I believe that XHB has more downside risk than upside potential. I’m looking for a retest of the 2022 lows with more downside to $48-$49. I expect this to happen in the fourth quarter and first months of 2023 until the Fed signals that its job is finished. Unfortunately, I do not expect that to happen anytime soon due to elevated inflation.
TradingView (XHB)
TradingView (XHB)
As I’m not sure where stocks will bottom, I’m mainly assessing risk/reward. When (or rather if) XHB makes it below $49, I will be a more aggressive buyer of housing-related stocks like the ones I just listed.
Needless to say, I will discuss more opportunities in the weeks ahead using this article as a basis – including appropriate and timely updates.
The housing market is weakening. Cracks are starting to appear as high rates and high home prices are hurting demand. The Fed’s goal of demand destruction in order to fight inflation is starting to look promising. Unfortunately, it’s hurting the economy where it hurts most. Home sales have started to implode, bidding wars are ending, and a major shift from buying to renting is occurring.
Even worse is that the Fed isn’t done hiking as inflation remains at unacceptable levels. This is now further working its way through the “system” as major banks who have provided liquidity for the housing market are now expected to hit the breaks to reduce risks. While that is a logical move, it actually increases housing risks as lower liquidity will (more than likely) hurt prices and demand even more.
I am closely watching the XHB ETF. This highly diversified ETF covers more than just homebuilders. It is home to everything related to housing and construction (except for REITs). Right now, the ETF is 33% below its 52-week high as the market has started to price in significant housing weakness.
In the months ahead, I expect more pain as housing developments are everything except going in the right direction.
My strategy is to prepare investments that I want to buy once XHB starts to fall below $50. I advise long-term investors to do the same. Investors can either buy XHB, which has a very acceptable total expense ratio, or one of its components.
However, for now, the way to play it is defensive. The Fed isn’t looking to ease anytime soon and it is actively betting that economic weakness will help in achieving inflation targets. We haven’t dealt with anything similar since the 1980s.
Long story, short: prepare for weakness, but don’t be discouraged. Use housing trends and increasingly favorable valuations to your advantage.
(Dis)agree? Let me know in the comments!
This article was written by
Disclosure: I/we have a beneficial long position in the shares of PSA, HD, NSC, UNP either through stock ownership, options, or other derivatives. I wrote this article myself, and it expresses my own opinions. I am not receiving compensation for it (other than from Seeking Alpha). I have no business relationship with any company whose stock is mentioned in this article.
Additional disclosure: This article serves the sole purpose of adding value to the research process. Always take care of your own risk management and asset allocation.